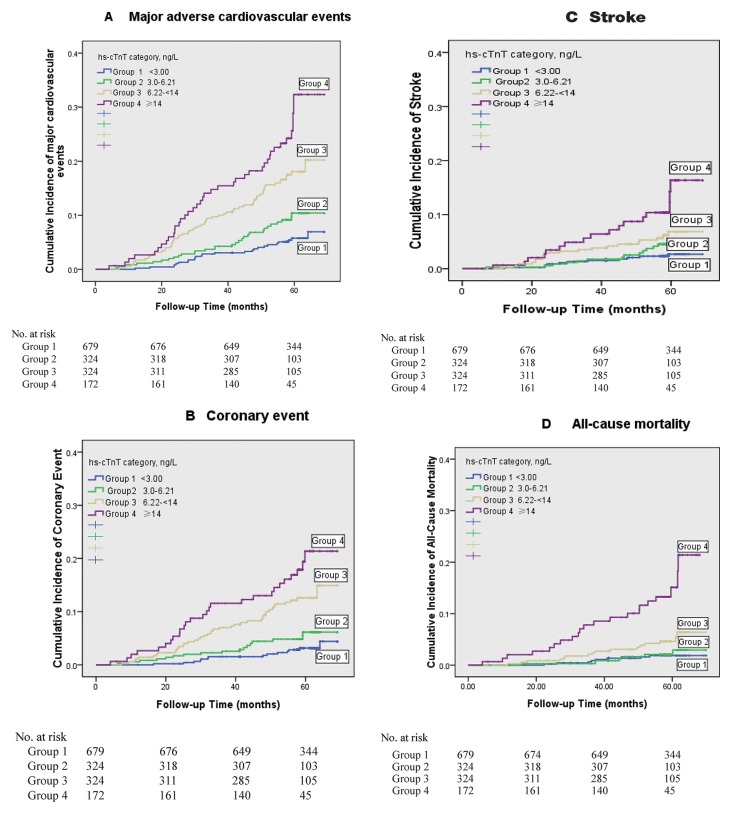
Figure 1.
Risk for cardiovascular events and all-cause mortality by baseline hs-cTnT level. Kaplan-Meier survival curves indicating cumulative incidence of major adverse cardiovascular events (A), coronary event (B), stroke (C) and all-cause mortality (D) across baseline hs-cTnT categories. Groups are indicated by colours; p<0.001 for all between-group comparisons by the log-rank test. Hs-cTnT, highly sensitive cardiac troponin T.

