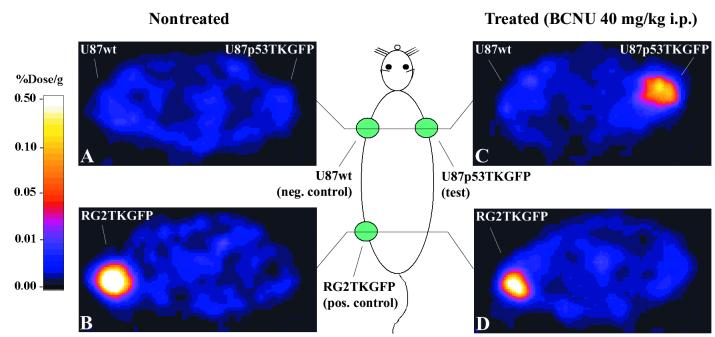
Figure 2.
PET imaging of endogenous p53 activation. Transaxial PET images through the shoulder (A and C) and pelvis (B and D) of two rats are shown; the images are color-coded to the same radioactivity scale (% dose/g). A nontreated animal is shown on the left, and a BCNU-treated animal is shown on the right. Both animals had three s.c. tumor xenografts: U87p53TKGFP (test) in the right shoulder, U87 wild-type (negative control) in the left shoulder, and RG2TKGFP (positive control) in the left thigh. The nontreated animal on the left shows localization of radioactivity only in the positive control tumor (RG2TKGFP); the test (U87p53TKGFP) and negative control (U87wt) tumors are at background levels. The BCNU-treated animal on the right shows significant radioactivity localization in the test tumor (right shoulder) and in the positive control (left thigh), but no radioactivity above background in the negative control (left shoulder).

