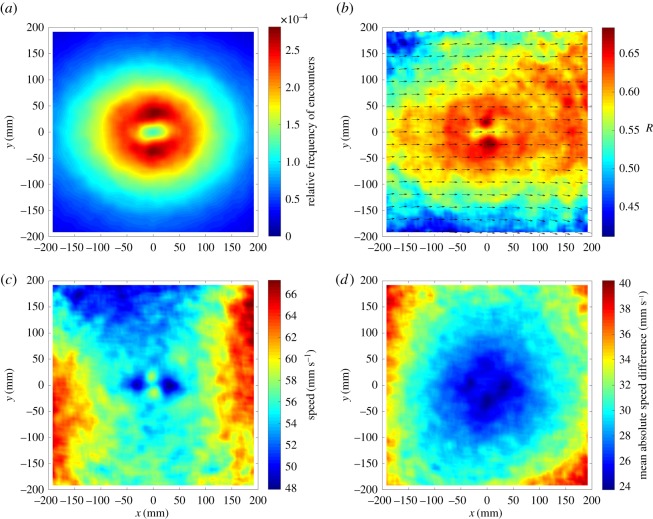
Figure 5.
Heat plots showing (a) the distribution of neighbours, (b) the mean relative direction of motion of neighbours (arrows) and polarization between focal fish and neighbour velocities, R, (c) the speed of focal fish as a function of relative neighbour positions (mean speed across all fish = 58 mm s−1) and (d) the mean absolute difference in speed between neighbouring fish and focal fish, all with respect to a focal fish centred at the origin and travelling parallel to the positive x-axis in groups of 10 or more sticklebacks, N = 33 groups, 740 individual fish.

