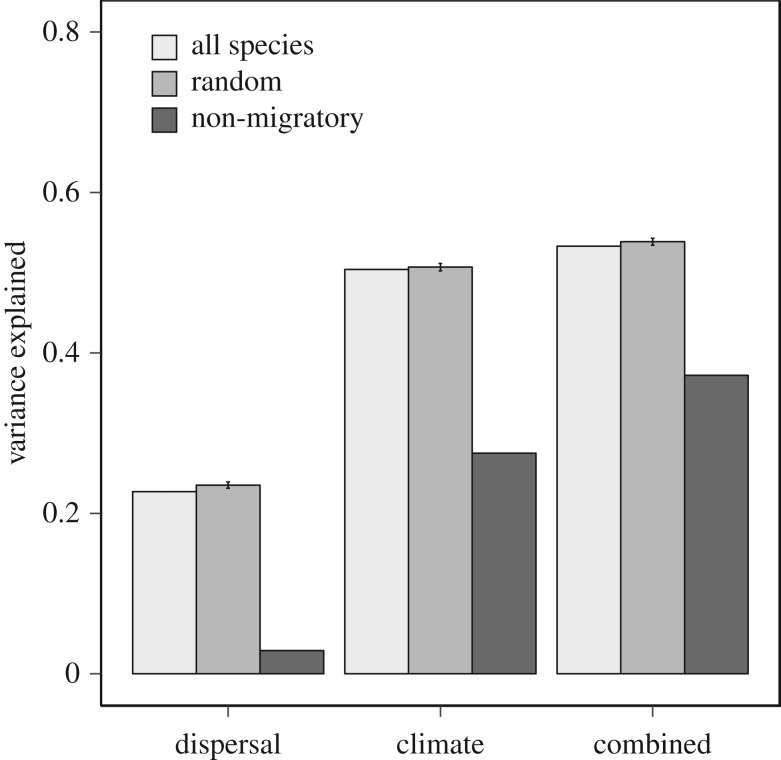
Figure 2.
Explained variance in spatial synchrony among Northern California butterfly species by SEM: limited to dispersal propensity (‘dispersal’), sensitivity to climate (‘climate’), or the combined influences of both drivers of spatial synchrony (e.g. dispersal and climate) (‘combined’). Dark grey bars represent SEM models from which migrants were excluded (leaving 56 species), while light grey bars represent variance explained when all species were considered (65 species). The ‘random’ bar represents variance explained for each model when nine species were randomly removed from the original 65 species. Models were permuted 1000 times and the mean and 95% confidence interval of variance explained is plotted (see Methods).

