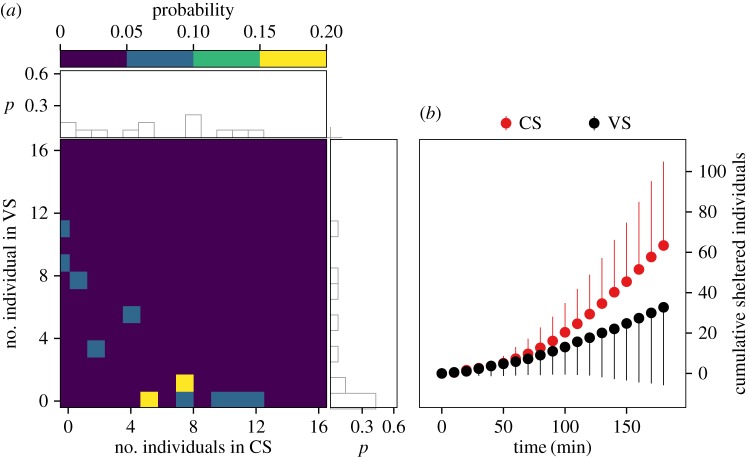
Figure 2.
(a) Two-dimensional probability distributions of the number of individuals in the shelters CS and VS (coloured figure) and their projection in one dimension (CS in horizontal and VS in vertical). (b) Average cumulative number of sheltered cockroaches (and its standard deviation) under each shelter as a function of time.

