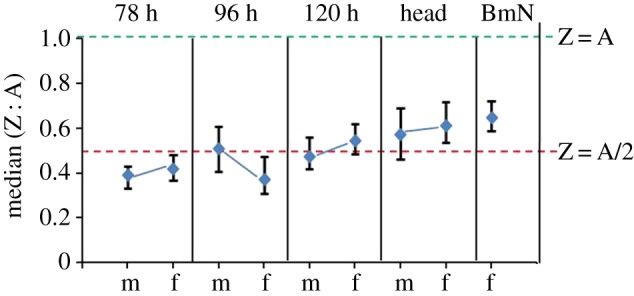
Figure 2.

The bootstrapped median of autosomes to Z chromosome (Z : A) gene expression ratios for the samples. The dashed lines (green and red) correspond to the relative expression of Z to that of autosomes. The ratio of Z : A of 1 and 0.5 indicates an equal (Z = A) and half expression (Z = A/2) of Z chromosome to that of autosomes, respectively. m, male; f , female. Error bars represent the 95% confidence intervals for the median estimated from 10 000 bootstrap replicates.
