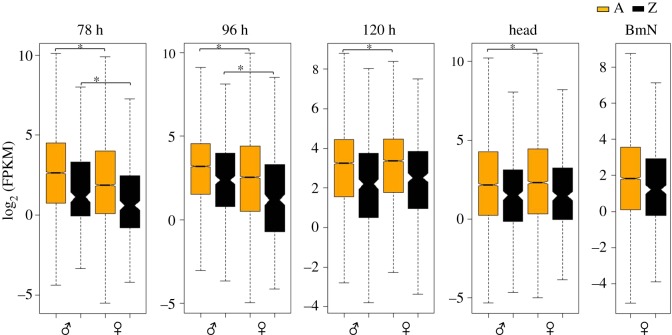
Figure 4.
Box plot of the log2-transformed FPKM distribution of autosomal (A, yellow) and Z-linked (Z, black) genes that expressed (FPKM ≠ 0) in both male and female samples. The boxes represent the interquartile range (IQR), the notch of box plots represents median (horizontal line) expression with a 95% confidence interval and outliers were not plotted. The data indicate a significant male-biased expression of autosomal and Z-linked genes at the early embryonic stages of 78 and 96 h (MWU, p < 0.0001). The asterisk indicates the significant difference observed between male and female autosomal or Z-linked genes. The significant difference observed between the autosomal genes at 120 h embryonic stage (MWU, p < 0.05) and head samples (MWU, p < 0.01) could be due to the local effects.

