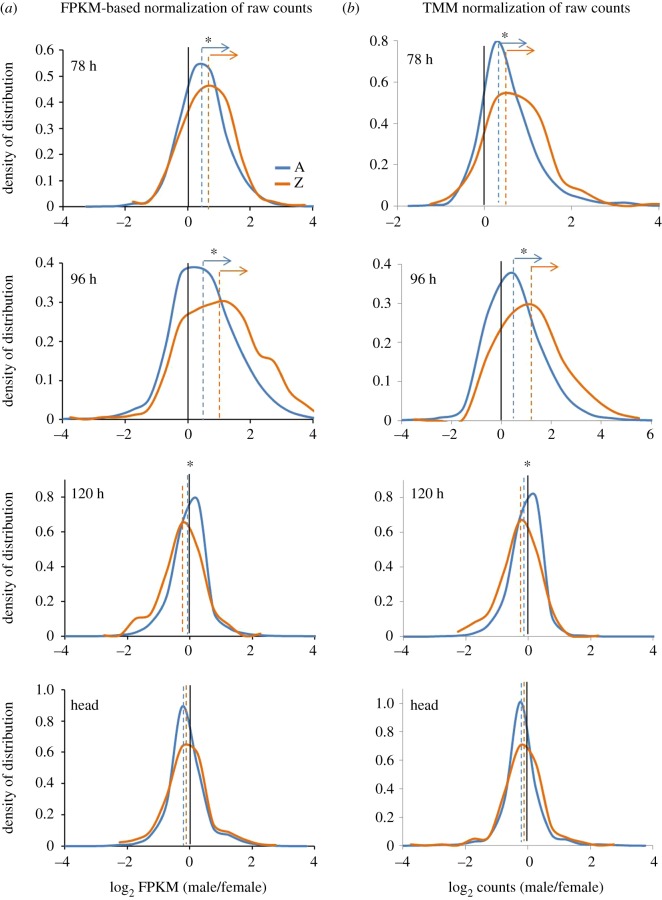
Figure 5.
The M : F distributions of autosomal and Z-linked genes in the embryonic (78, 96 and 120 h) and head samples. (a) The M : F distributions from FPKM-based normalization of raw counts. (b) The M : F distributions from TMM normalization of raw counts. The dashed vertical lines represent the median of the frequency distributions (shown in dashed lines). An asterisk represents the significant difference (MWU, p < 0.01) observed between autosomal and Z-linked M : F distributions. At 78 and 96 h stages, the arrows indicate the profound male-biased expression of autosomal (MWU, p < 2.2 × 10⁻¹⁶) and Z-linked (MWU, 78 h, p = 0.0005 and 96 h, p = 2.127 × 10⁻⁹) genes.

