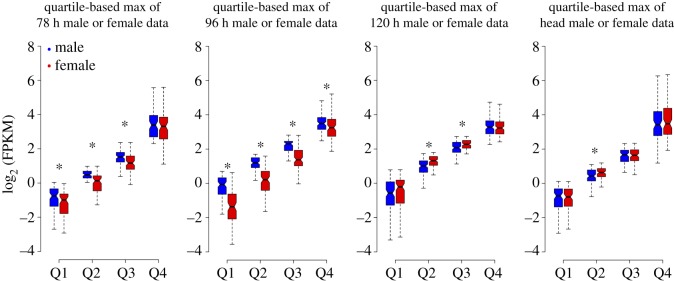
Figure 6.
Comparison of quartile expressions for Z-linked genes dataset used for M : F analysis. The log2 FPKM expression data for the Z-linked genes were segregated as quartiles based on max of male- or female-paired data. The boxes represent the interquartile range (IQR), the notch of box plots represents median (horizontal line) expression with a 95% confidence interval and the outliers were not plotted. The asterisk indicates a significant difference between quartile expressions (MWU, p < 0.05).

