
Figure 2.
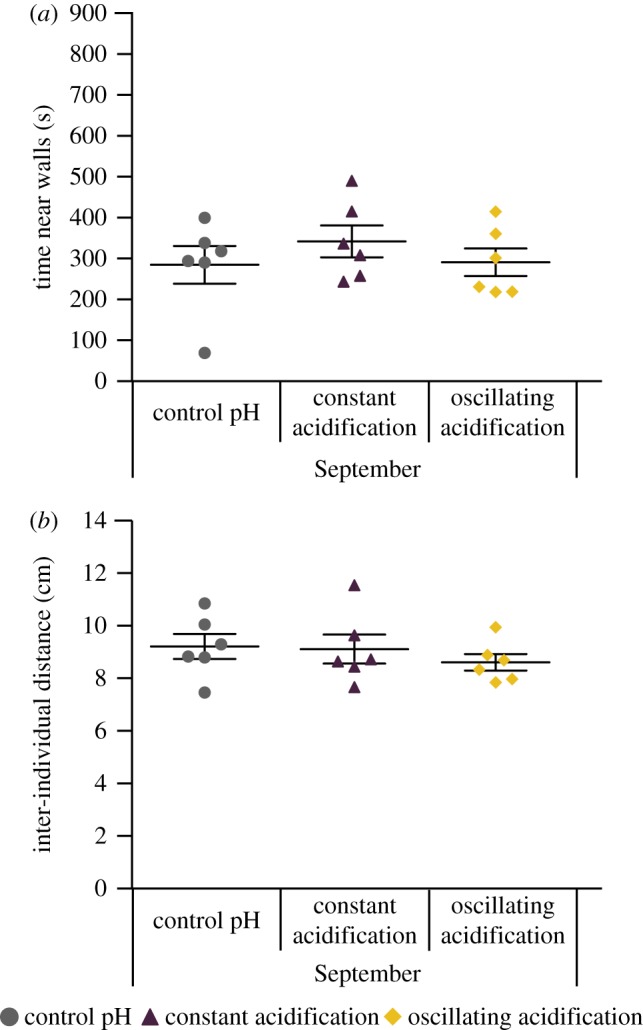
Control, constant acidification and oscillating acidification-exposed Chromis punctipinnis were placed into a shoaling test arena in groups of five and their locations recorded for 900 s (n = 6 shoals per treatment). (a) Time near walls was not affected by CO2/pH treatments (F2,15 = 0.621, p = 0.551). (b) Inter-individual distance was also not affected by CO2 treatments (F2,15 = 0.502, p = 0.615). Data presented as mean ± s.e.m. This test was only performed on the September groups.