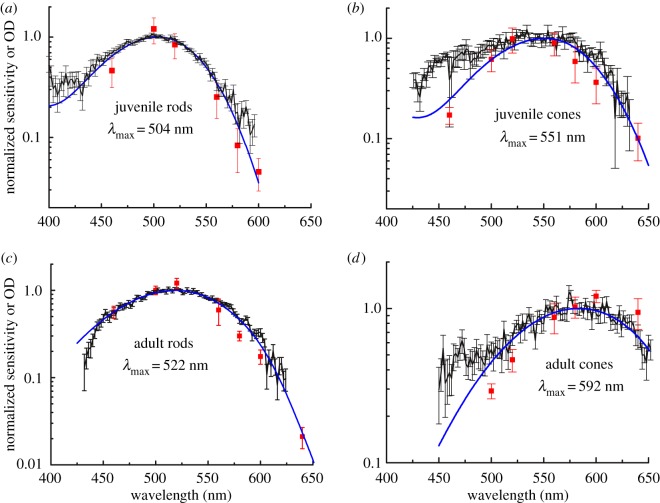
Figure 3.
The photoreceptor spectral sensitivities of adult upstream migrant lamprey are long-wavelength shifted compared with those of juvenile downstream migrants. Normalized absorption spectra and spectral sensitivities for each condition are superimposed in a single graph. Black data points and black connecting lines represent microspectrophotometric determinations of mean pigment absorbance (±s.e.) normalized to absorbance at λmax, taken from 58 juvenile rods (a), nine juvenile cones (b), 70 adult rods (c) and 23 adult cones (d). Red data points represent the normalized mean spectral sensitivities (± s.e.) from suction-electrode recordings of nine juvenile rods (a), seven juvenile cones (b), 13 adult rods (c) and 14 adult cones (d). Blue curves for (a) and (b) are A1 visual-pigment nomograms [20] for best-fitting λmax's of 504 nm for rods and 551 for cones; or weighted averages of A1 and A2 nomograms for adult photoreceptors (c,d) with best-fitting values of 18% A1 and 82% A2 for rods (c) and 14% A1 and 86% A2 for cones (d). The A1/A2 mixture modelling approach was adapted from Kefalov et al. [21].

