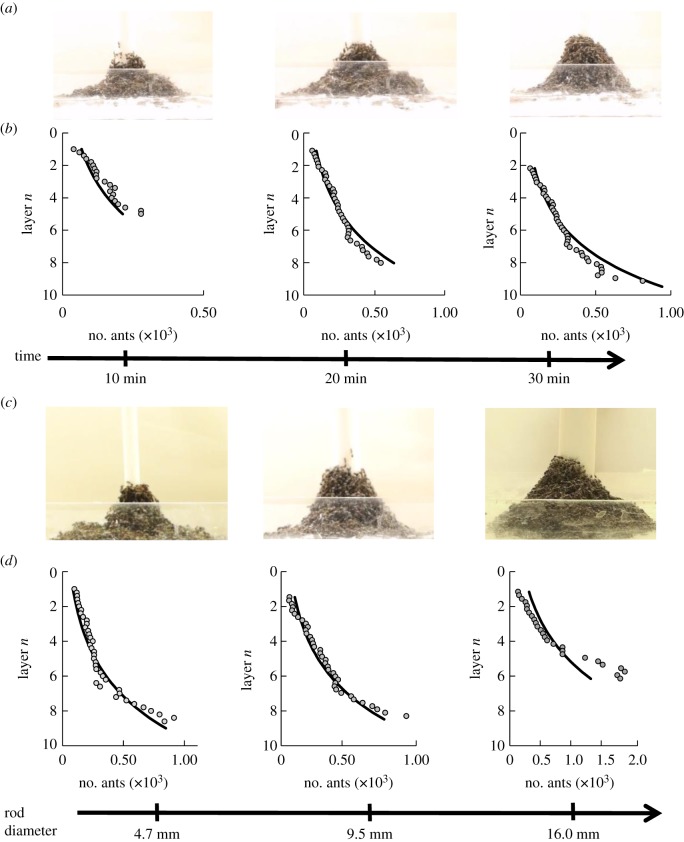
Figure 3.
Ant tower profile. (a) A time sequence of an ant tower built on an 8 mm diameter Teflon rod. (b) The fit of the shape model to the profile of a 10 min, 20 min and equilibrium ant tower. (c) The equilibrium shape of ant towers built on 4.7, 9.5 and 16.0 mm rod diameters. (d) The fit of the shape model to the profile of the equilibrium ant towers on increasing rod diameters. The circles represent the profiles of the towers. We fit these profiles to the shape model, shown by the solid lines, using carrying capacity α=3.0.

