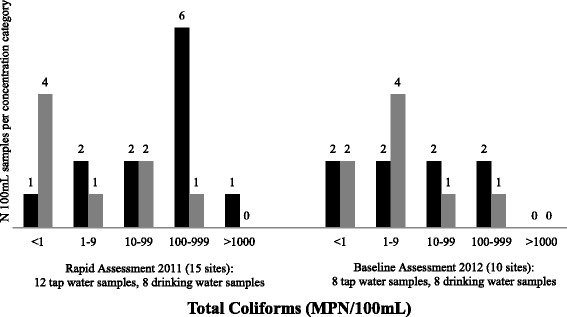
Fig. 1.

Total coliform concentration (MPN/100 mL) in tap water samples and treated drinking water samples from rural health centers in Rwanda collected during rapid assessment in 2011 and baseline assessment in 2012. Black: Tap water samples, Grey: Treated drinking water samples. Rapid assessment results for 12 tap water samples and 8 drinking water samples are presented. Note that 1HCF had no water and 4 HCFs had no drinking water at the time of the assessment visit. Samples from 2 HCF were excluded because the amount of time between sample collection and analysis exceeded the time defined in standard methods. Baseline assessment results for 8 tap water samples and 8 drinking water samples are presented. No water was available at 2 HCF during the assessment visit
