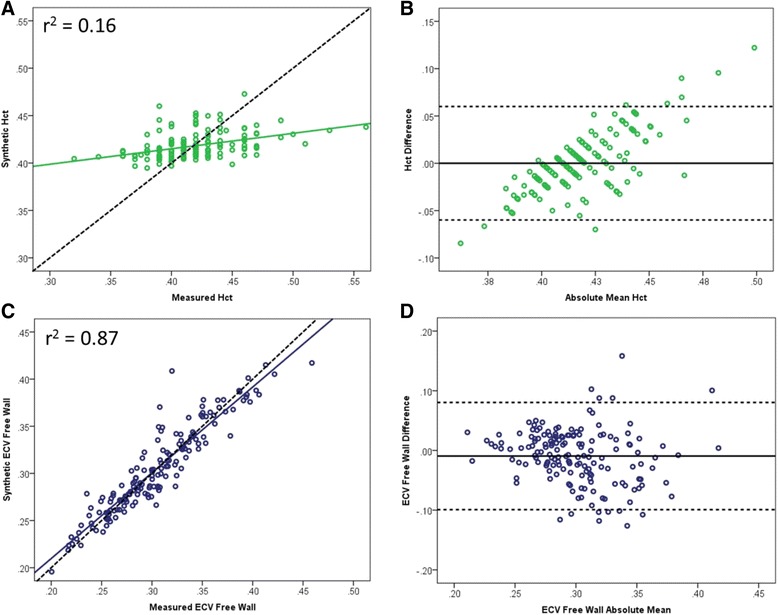
Fig. 3.

Linear regression fit of measured vs synthetic Hct and ECV for local model. Similarly poor regression fit using the local model (a) with elimination of bias on Bland-Altman analysis (b). There was a tendency for the local equation to overestimate Hct at higher values and underestimate Hct at lower values. However there was excellent fit for measured vs synthetic ECV at the mid-free wall (c) without significant bias on Bland-Altman analysis (d). Dashed line in A and C represents line of identity. For Bland-Altman plots, solid line represents mean difference and dashed lines (B and D) are ±1.96SD
