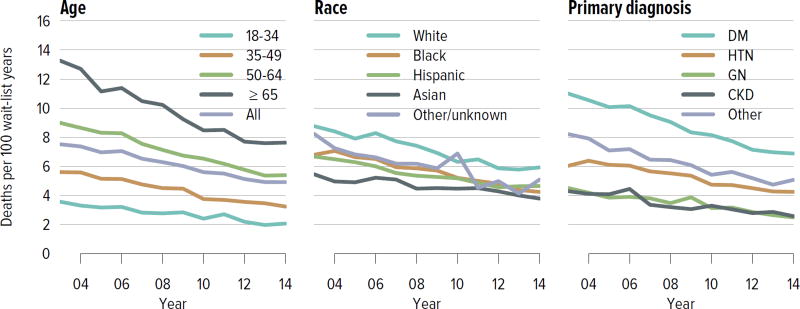
Figure KI 1.9. Mortality rates among adults waitlisted for kidney transplant.
Mortality rates are computed as the number of deaths per 100 patient-years of waiting in the given year. Individual listings are counted separately. Rates with less than 10 patient-years of exposure are not shown. Age is determined at the later of listing date or January 1 of the given year. CKD, cystic kidney disease; DM, diabetes. HTN, hypertension. GN, glomerulonephritis.

