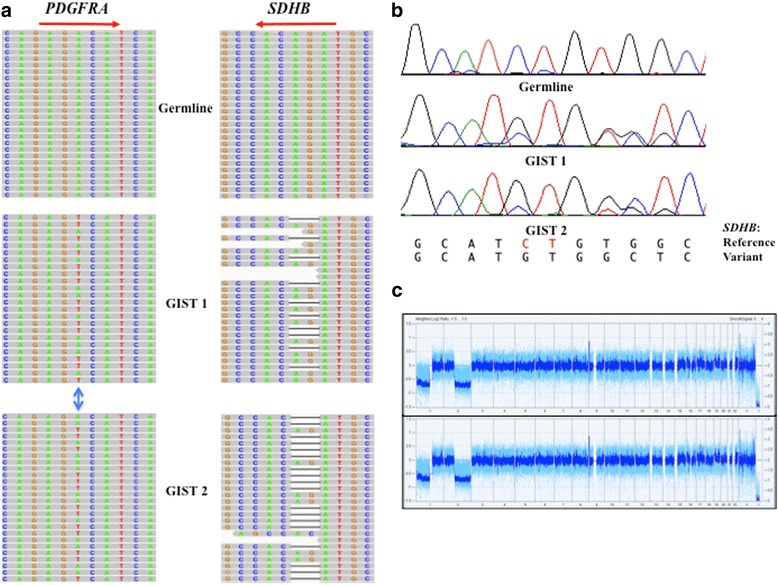
Fig. 2.

a A subset of reads from WES analysis visualized on the Integrative Genomics Viewer (IGV). Left panels show the heterozygous PDGFRA c.2525A > T mutation in the two tumors (indicated by double-headed blue arrow) that results in the p.D842V amino acid change. Right panels show the two base-pair deletion in exon 4 of the SDHB gene (represented as a bar) in reads from both tumors but not in the patient’s germline DNA. Red arrow indicates direction of transcription of PDGRA and SDHB. b Sanger sequencing confirming the frameshift SDHB deletion (c.291_292delCT, p.Iso97Metfs*21) in the patient’s GISTs. In the reference sequence the deleted bases are shown in red, and the variant sequence can be seen overlaying the reference sequence in the chromatograms from the tumors. c Whole genome view from the Chromosome Analysis Suite (Affymetrix) shows weighted SNP log-2 ratio (light blue) and smoothened signal (dark blue) for GIST 1 (top panel) and GIST 2 (bottom panel). Large-scale chromosome losses across chromosome arms 1p and 2q can be seen in both tumors
