Figure 2.
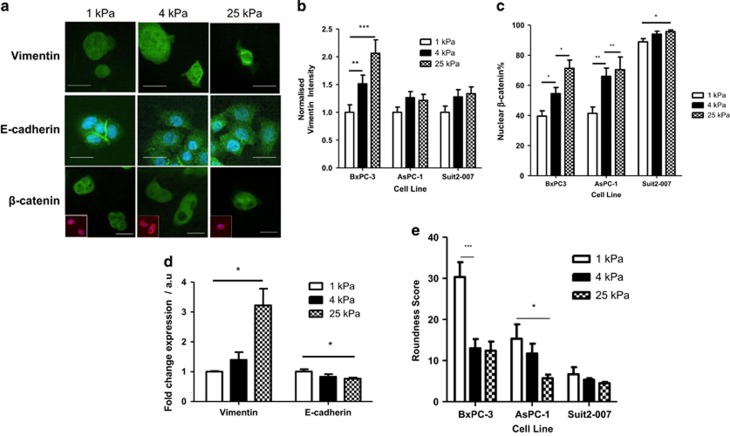
Role of matrix stiffness in EMT induction. (a) Vimentin, E-cadherin and β-catenin immunofluorescence images of BxPC-3 cells on matrices of varying stiffness. For β-catenin, main image shows merge of marker staining (green), top right inset is marker staining and bottom left inset is phalloidin staining (red) of actin cytoskeleton to show cell shape and DAPI (blue). Scale bar=25 μm. (b) Normalised vimentin intensity (corrected cell total fluorescence). For 1, 4 and 25 kPa, respectively, BxPC-3, n=33, 39, 31; AsPC-1, n=31, 35, 29; Suit2-007, n=41, 33, 45. Values represent mean±s.e.m. **P<0.01, ***P<0.0001. (c) Nuclear localisation percentage for β-catenin and YAP. For 1, 4 and 25 kPa, respectively, BxPC-3, n=13, 9, 13; AsPC-1, n 10, 11, 7; Suit2-007, n=11, 11, 12. Values represent mean±s.e.m. *P<0.05, **P<0.01. (d) Expression of EMT markers vimentin and E-cadherin at the mRNA level. Values represent mean±s.e.m. For an unpaired t-test, *P<0.05. N values for each protein at 1, 4 and 25 kPa, respectively, vimentin: 4, 6, 5; E-cadherin: 3, 6, 4. (e) Quantification of roundness for cells grown on matrices of varying rigidities. For 1, 4 and 25 kPa, respectively, BxPC-3, n=13, 15, 15; AsPC-1, n=19, 19, 15; Suit2-007, n=17, 13, 13. Values represent mean±s.e.m. *P<0.05, ***P<0.001.

