Figure 4.
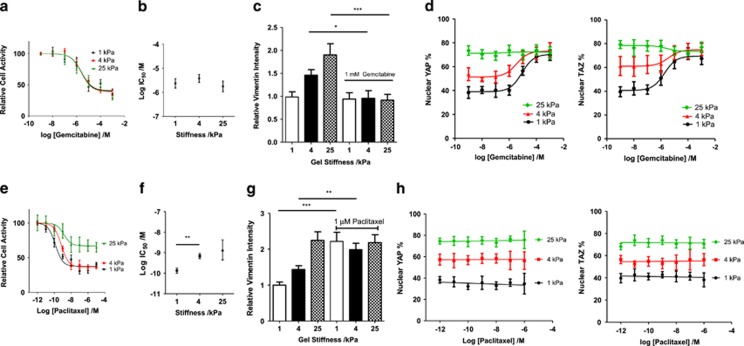
The role of matrix stiffness in gemcitabine and paclitaxel chemoresistance. (a) Dose–response curve for BxPC-3 cell viability with increasing concentrations of gemcitabine. For 1, 4 and 25 kPa, respectively, total n=81, 74, 65. Values represent mean±s.e.m. (b) IC50 values from dose–response curves in panel (a). Values represent mean±s.e.m. (c) Normalised vimentin intensity (corrected cell total fluorescence). For 1, 4 and 25 kPa, respectively, for control conditions, n=23,20,20. For 1, 4 and 25 kPa, respectively, for 1 mM gemcitabine conditions, n=18, 13, 15. Values represent mean±s.e.m. *P<0.05, ***P<0.001. (d) Changes in population nuclear YAP percentage. For 1, 4 and 25 kPa, respectively, total n=76, 74, 78. Changes in population nuclear TAZ percentage. For 1, 4 and 25 kPa, respectively, total n=72, 76, 68. Values represent mean±s.e.m. (e) Dose–response curve for BxPC-3 cell viability with increasing concentrations of paclitaxel. For 1, 4 and 25 kPa, respectively, total n=58, 67, 54. Values represent mean±s.e.m. (f) IC50 values from dose–response curves in panel (e). Values represent mean±s.e.m. (g) Normalised vimentin intensity (corrected cell total fluorescence). For 1, 4 and 25 kPa, respectively, for control conditions, n=42, 39, 23. For 1, 4 and 25 kPa, respectively, for 1 mM gemcitabine conditions, n=32, 20, 30. Values represent mean±s.e.m. **P<0.01, ***P<0.001. (h) Changes in population nuclear YAP percentage. For 1, 4 and 25 kPa, respectively, total n=58, 56, 66. Changes in population nuclear TAZ percentage. For 1, 4 and 25 kPa, respectively, total n=77, 59, 65. Values represent mean±s.e.m.

