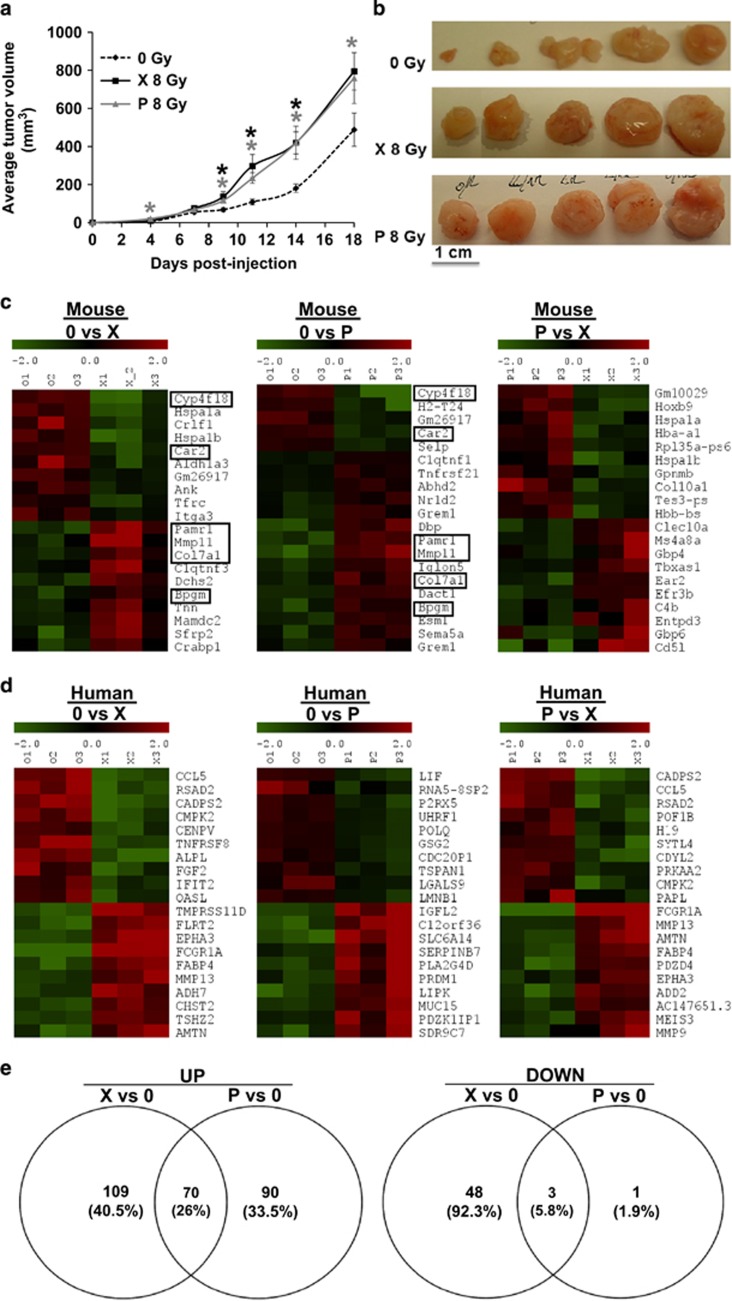
Figure 3.
Evaluation of tumors generated following xenografting of either non-irradiated, P or X irradiated CAL33 cells in immunodeficient mice. (a) Average tumor volume (mm3); (b) Representative images of tumor xenografts; (c) Heatmap of 10 most up- and downregulated mouse genes in tumors generated by non-irradiated cells versus P or X tumors, and in P versus X tumors; (d) Heatmap of 10 most up- and downregulated human genes in tumors generated by non-irradiated cells versus P or X tumors, and in P versus X tumors; (e) Venn diagrams showing common upregulated and downregulated human genes between P and X tumors. Framed genes are commonly expressed in P and X tumors. Selection is adjusted P-value<0.05 and lofFC>1.

