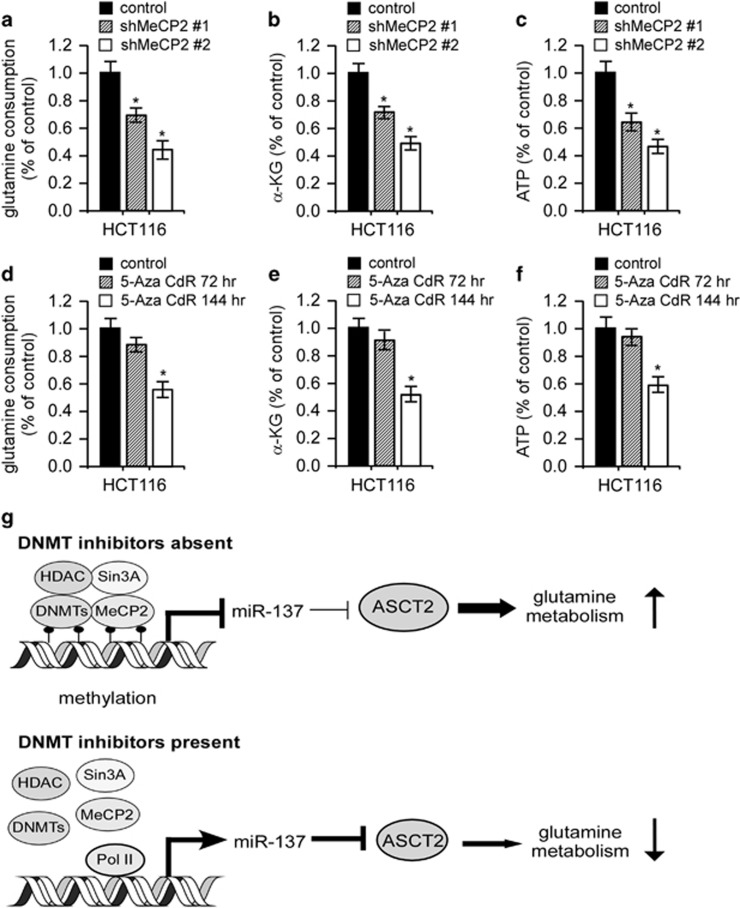
Figure 7.
Metabolic analysis upon MeCP2 depletion or DNMTs inhibition. (a–c) Relative changes in glutamine consumption (a), α-KG production (b) and intracellular ATP content (c) in HCT116 cells upon MeCP2 depletion. Mean±s.d. (n=3), t-test; *P<0.05. (d–f) Relative changes in glutamine consumption (d), α-KG production (e) and intracellular ATP content (f) in HCT116 upon DNMTs inhibition. Mean±s.d. (n=3), t-test; *P<0.05. (g) A simplified model depicting ASCT2 regulation by miR-137. See text for more details.

