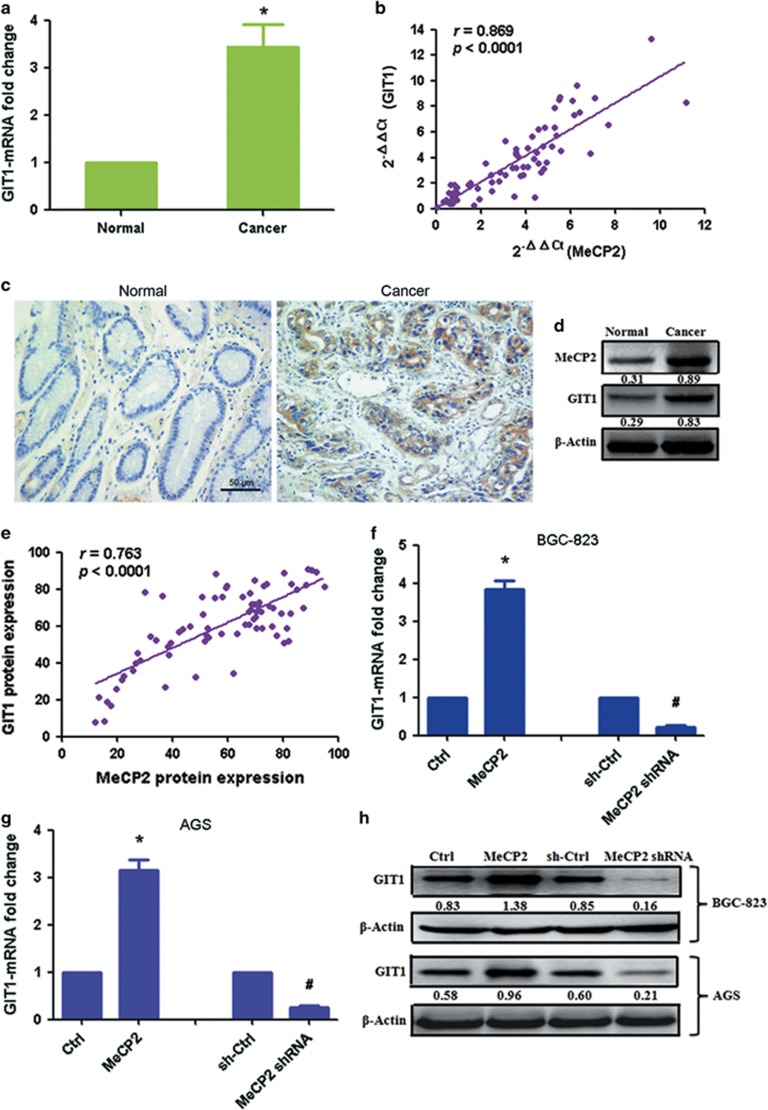
Figure 6.
MeCP2 facilitates the expression of GIT1 in GC cells. (a) GIT1 mRNA expression in GC tissues versus normal tissues. *P<0.01. (b) MeCP2 and GIT1 expressions showed a positive correlation. The 2−ΔΔCt values of MeCP2 and GIT1 mRNA were subjected to a Pearson correlation analysis (n=76, r=0.869, P<0.0001). (c) Protein levels of GIT1 in tumor tissues and normal tissues were measured by immunohistochemical staining. (d) Protein expression levels of GIT1 and MeCP2 were measured by western blotting. (e) MeCP2 and GIT1 protein expressions showed a positive correlation (n=76, r=0.763, P<0.0001). (f) GIT1 mRNA expression in BGC-823 cells transfected with MeCP2 shRNA or MeCP2 overexpression vector. *P<0.01 compared with Ctrl, #P<0.01 compared with sh-Ctrl, n=3. (g) GIT1 mRNA expression in AGS cells after transfection. *P<0.01 compared with Ctrl, #P<0.01 compared with sh-Ctrl, n=3. (h) GIT1 protein expression after transfection with MeCP2 shRNA or MeCP2 overexpression vector.

