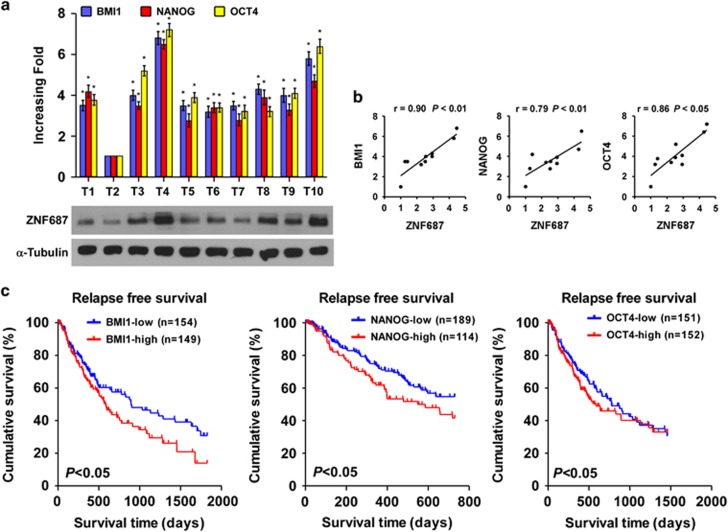
Figure 8.
ZNF687 levels correlated with BMI1, NANOG and OCT4 expression in HCC clinical tissues. (a) Expression analysis and (b) correlation analysis of ZNF687 expression and BMI1, NANOG and OCT4 mRNA levels in 10 fresh HCC tissue samples (T). Bars, mean±s.d. of three independent experiments. (c) Kaplan–Meier analysis of relapse-free survival curves from TCGA data set of patients with HCC with relatively low or relatively high BMI1, NANOG and OCT4 expression (P<0.05). riments. *P<0.05.

