Figure 2.
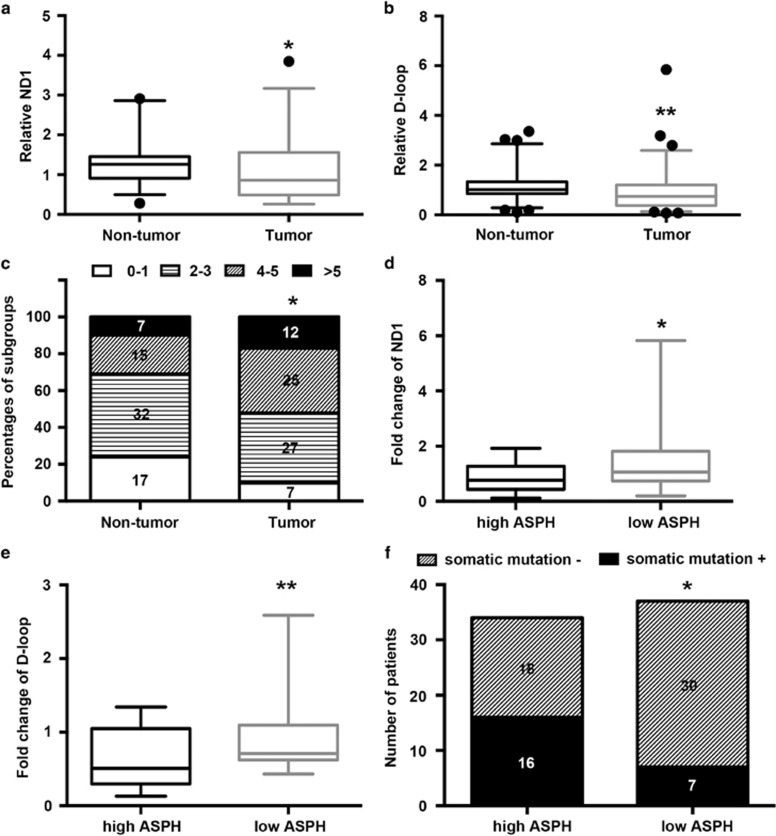
ASPH expression level affects mtDNA stability in HCC tissues. (a, b) Box plot of the relative copy number of ND-1 and D-loop in mtDNA extracted from tumor and matched non-tumor tissues (n=71) that was detected by real-time PCR and normalized to the amounts of β-actin DNA. (c) Percentages of subgroups of tumor and non-tumor tissues based on the amount of single-nucleotide variation in the D-loop region identified by Sanger sequencing. The number of patients in each subgroup was marked in the corresponding column. (d, e) Ratios of tumoral ND-1 and D-loop copy number to matched non-tumor tissues assayed by real-time PCR in the subgroups of HCC patients with high (n=34) or low (n=37) ASPH expression. (f) The number of patients with or without somatic mutation in the D-loop region of mtDNA detected by Sanger sequencing in HCC patients with high (n=34) or low (n=37) ASPH expression. For all box plots, the band inside the box was the mean value and the ends of the whiskers represented the minimum and maximum of 2.5–97.5 percentile of all data. **P<0.01, *P<0.05 vs groups of non-tumor tissues or high ASPH expression as indicated.

