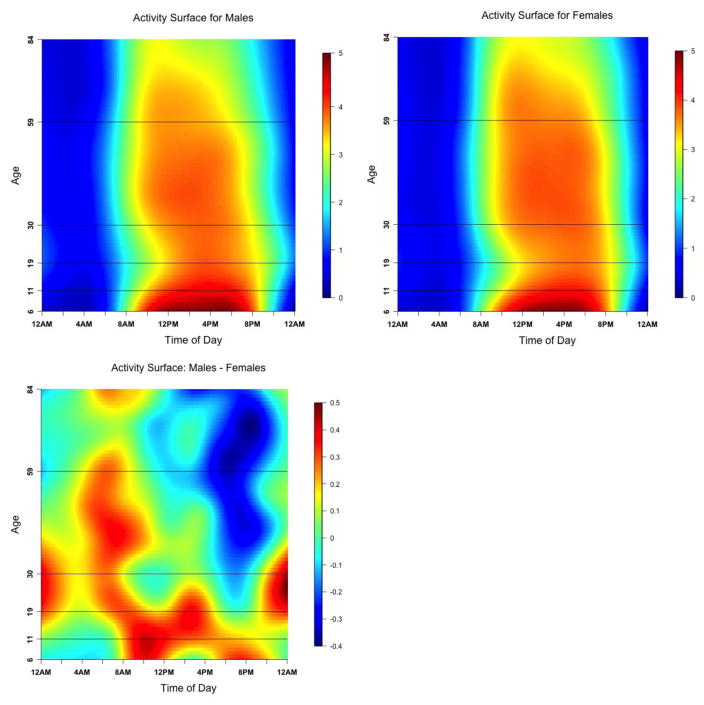
Figure 3.
The diurnal distribution of LAC over the lifespan (6 years old to 84 years old) for males (top left), females (top right) and the difference between males and females (bottom).
LAC = log-transformed activity counts
The diurnal distribution of LAC is represented by a surface with time of day as the horizontal dimension and age as the vertical dimension. Dark blue and dark red colors correspond to lower and higher levels of PA, respectively.

