
Fig. 7.
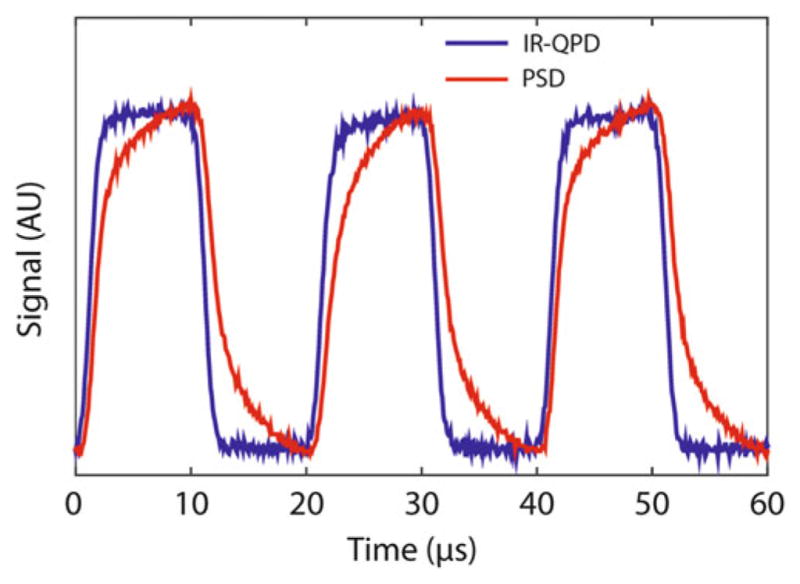
Comparison of IR-enhanced QPD to PSD for IR laser detection. The trapping laser power measured by an IR-enhanced QPD (blue) and PSD (red) during its ON/OFF interlacing cycle is shown. The PSD exhibits parasitic low-pass filtering, characterized by long rise and fall times (reproduced from ref. [16] with permission from Nature Publishing Group)