
Figure 3.
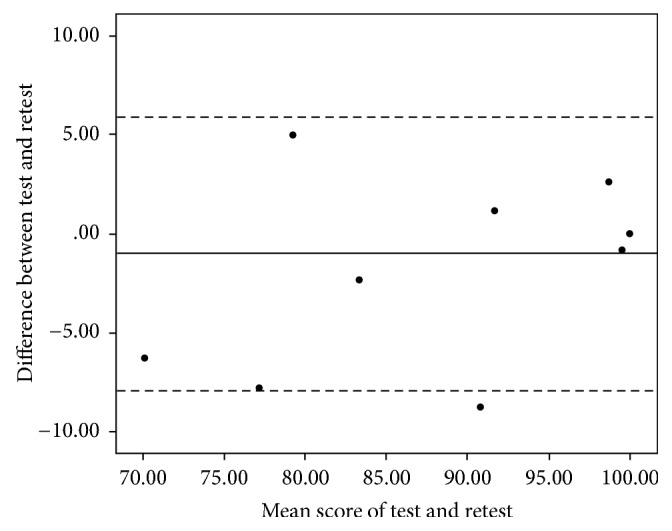
Bland-Altman plot of the test-retest reliability of the Dutch TESS-UE. The solid line shows the mean difference of the two tests (−1.01) and the dashed lines show the 95% limits of agreement (−7.89; 5.86). The dot with 0 difference between test and retest and a 100 mean score represents ten patients.