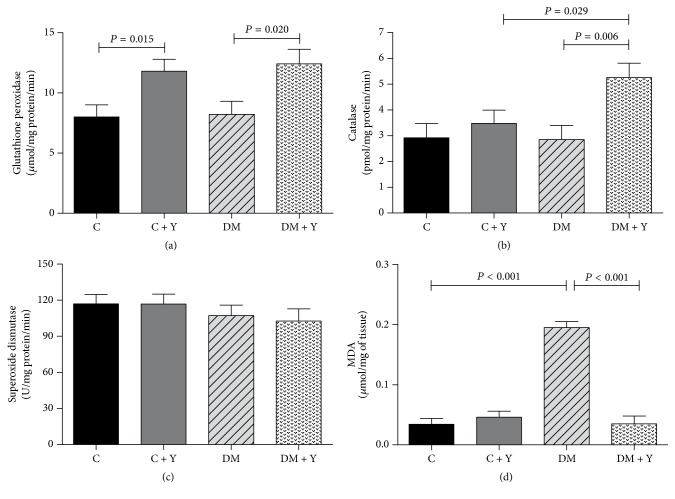
Figure 2.
(a) Catalase (CAT) activity; (b) superoxide dismutase (SOD) activity; (c) glutathione peroxidase (GPx) activity; (d) MDA concentration in soleus of the different experimental groups. C (control group): normal rats; C + Y: normal rats receiving HEYL; DM: diabetic rats; and DM + Y: diabetics rats receiving HEYL. The results are expressed as the mean ± SEM.

