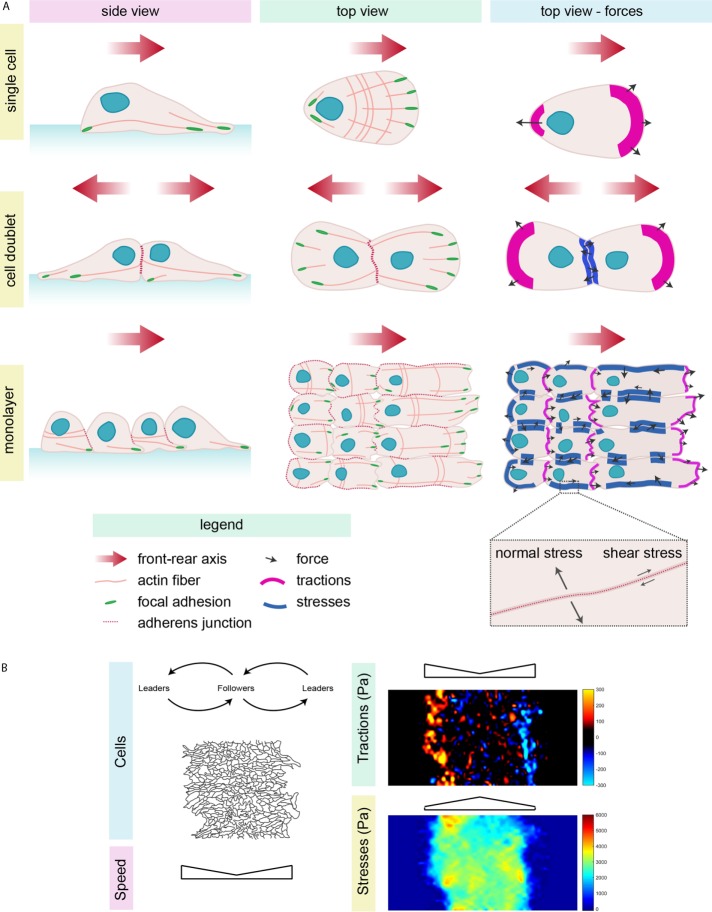
FIGURE 4:
Cell migration and force transmission and their study in collective migration. (A) Single cell (top), doublets (middle), and a migrating monolayer (bottom) from the side and top views. Cells (light pink) show a polarized (red arrow, front–rear axis of migration) morphology, with the nucleus (blue) at the back, an asymmetric distribution of focal adhesions (green) and actin (pink lines), microtubule (not shown), and intermediate filament (not shown) networks. Cell–cell contacts (red dotted line) allow adhesion between cells. The third column shows representative forces (tractions on the substrate in magenta and intercellular stresses in blue); tractions are high at the cell front, whereas intercellular stresses concentrate at cell–cell contacts. The gray arrows represent possible forces and their directions. (B) Representative images of cells migrating on hydrogels (black lines show the cell edges). Collectively migrating cells are divided into leaders and followers, which influence one another. The speed of migration is higher at the edges of the monolayer, as are tractions. Tractions are calculated by TFM (bead displacements) and are higher where the color intensity is stronger—yellow and blue correspond to the maximal forces in opposite directions along the axis of migration. Stresses, calculated with MSM, are higher at the center of the migrating monolayer (strong intensity in red). TFM and MSM images were obtained on migrating astrocytes on a 9-kPa collagen-coated hydrogel by C.D.P. and C. Pérez González.

