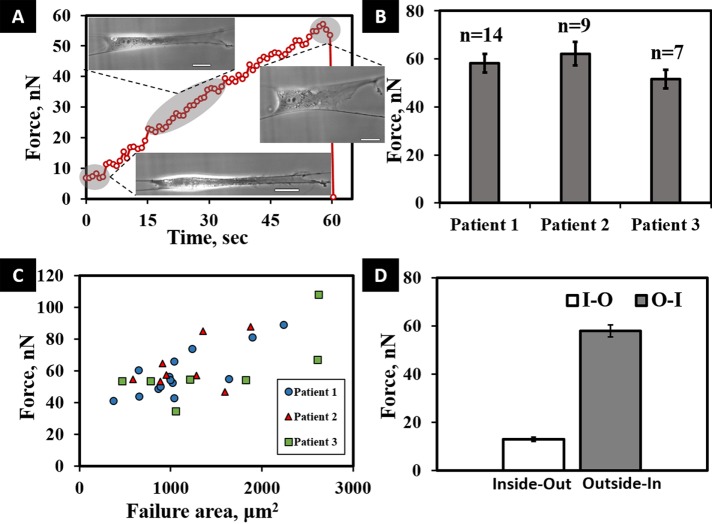
FIGURE 4:
(A) Typical transient force response curve for a cell undergoing O-I perturbation, with a drop at 60 s indicating the maximum cell–fiber adhesion strength. Included in the figure are images of the same cell under different stretched conditions. Scale bars are 20 µm. (B) Average O-I forces for the three populations, with no significant variation. (C) Linear least-squares regression analysis shows failure forces and area at failure to be moderately correlated across all SMC populations undergoing O-I perturbation (R2 = 0.494). (D) I-O and O-I vertical force comparison, with force values averaged across the cell populations, showing a fivefold difference in the I-O and O-I forces (p < 0.01). Error bars represent standard error.

