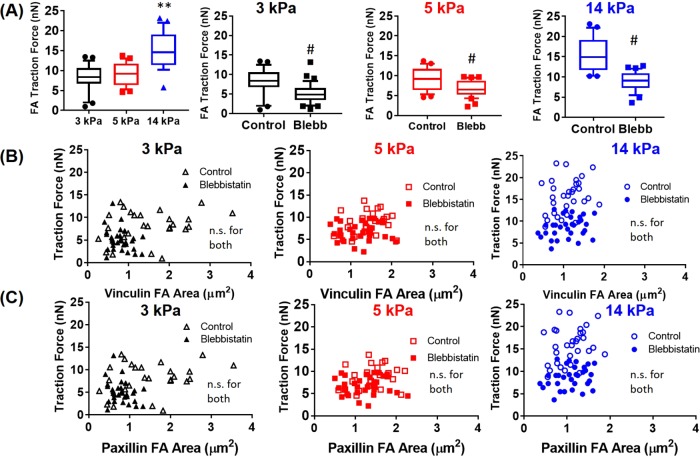
FIGURE 4:
Traction forces at single FAs for MEFs expressing T12 vinculin and WT paxillin in the presence or absence of blebbistatin. (A) Traction forces for T12 MEFs cultured on mPADs of 3, 5, and 14 kPa (n > 25 FAs, randomly selected from six cells for each condition). p < 0.01 for one-way ANOVA, **p < 0.01 vs. 3 and 5 kPa, #p < 0.01 vs. blebbistatin. (B, C) Relationship between traction force and FA area at single FAs.

