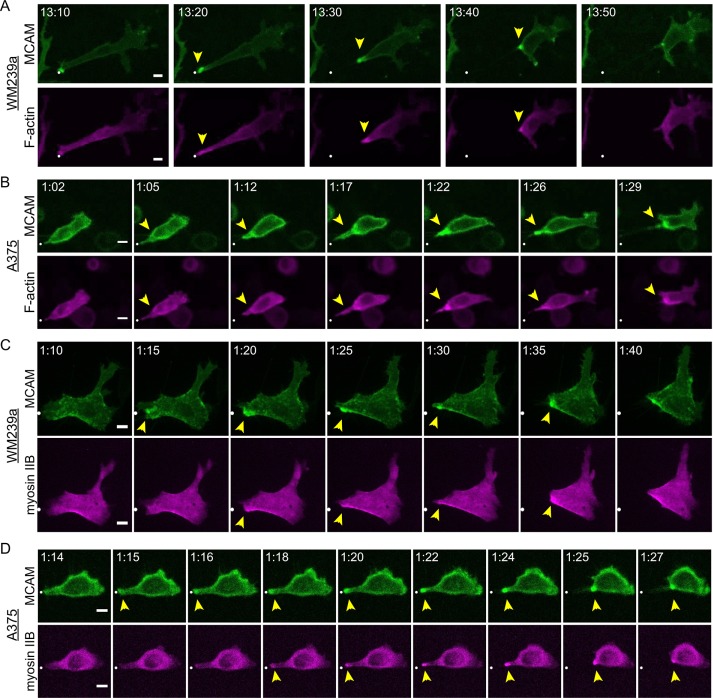
FIGURE 2:
Dynamic movement of WRAMP structures, followed by membrane retraction. Frames from confocal live-cell imaging experiments of (A) WM239a and (B) A375 cells cotransfected with MCAM-GFP and LifeAct-mCherry and (C) WM239a and (D) A375 cells cotransfected with MCAM-GFP and myosin IIB-N18-mCherry. Supplemental Movies S2–S5 (corresponding to A–D, respectively) show coordinated movement of MCAM, F-actin, and myosin IIB. White dot indicates starting position. Scale bars, 10 µm; times in hours:minutes. Controls for this experiment with MCAM-GFP plus mCherry in Supplemental Figure S1 and Supplemental Movies S6 and S7. Quantitation of MCAM-GFP and myosin IIB-mCherry (or LifeAct-mCherry) fluorescence vs. time is shown in Supplemental Figure S2.

