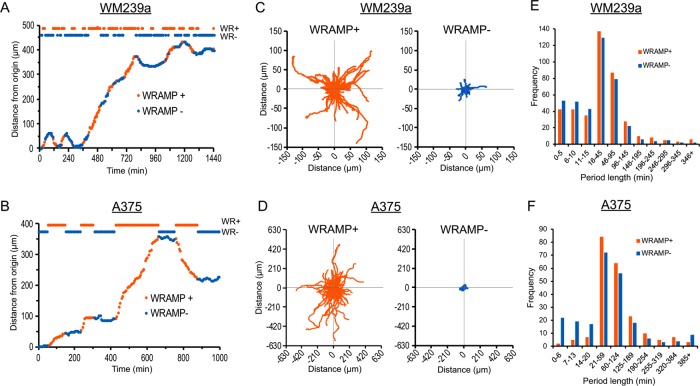
FIGURE 6:
Migrating cells fluctuate between periods when WRAMP structures are present and periods when they are absent. (A, B) Trajectories for single representative (A) WM239a and (B) A375 cells, showing distance from origin vs. time. Periods when WRAMP structures are present (WRAMP+, orange) and absent (WRAMP–, blue) are indicated in trajectory plots and projections at the top, where each point represents one frame. (C, D) Cell trajectories for 250 WRAMP+ and 250 WRAMP– segments, each observed in (C) 28 WM239a and (D) 28 A375 cells. Cell position at the start of each segment starts at 0, 0 and follows trajectories to the end of the segment. (E, F) Lengths of periods in minutes for WRAMP+ and WRAMP– segments from (E) 30 WM239a and (F) 30 A375 cells. Histograms show similar period lengths between WRAMP+ and WRAMP– segments. All cells were treated with recombinant Wnt5a at the start of the experiment.

