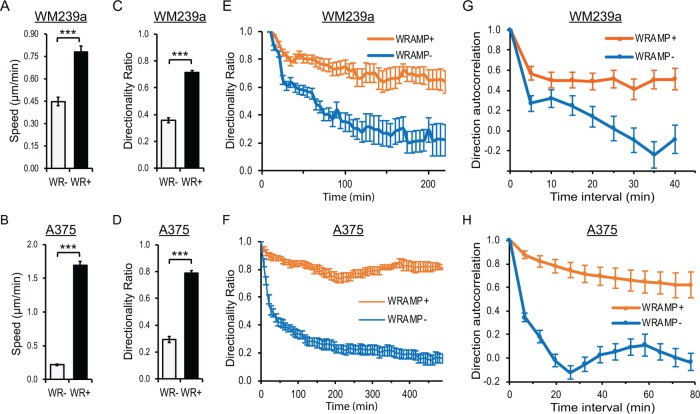
FIGURE 7:
Quantitative measurements of cell movement. (A, B) Cell speed during WRAMP+ (WR+) and WRAMP– (WR–) segments were calculated in (A) WM239a (30 cells) and (B) A375 cells (30 cells). Values report mean and SEM, ***p < 0.0001. The p values were calculated using standard two-tailed Student’s t test. (C, D) Directionality ratio calculated at the final time point in WRAMP+ and WRAMP– segments; mean and SEM for 30 (C) WM239a and (D) A375 cells. The p values were calculated using standard two-tailed Student’s t test, ***p < 0.0001. (E, F) Directionality ratio calculated vs. time for WRAMP+ and WRAMP– segments in (E) WM239a and (F) A375 cells. (G, H) Direction autocorrelation of trajectories for WRAMP+ and WRAMP– segments at least 12 frames long in 30 (G) WM239a and (H) A375 cells. Error bars indicate SEM. All cells were treated with recombinant Wnt5a at the start of the experiment.

