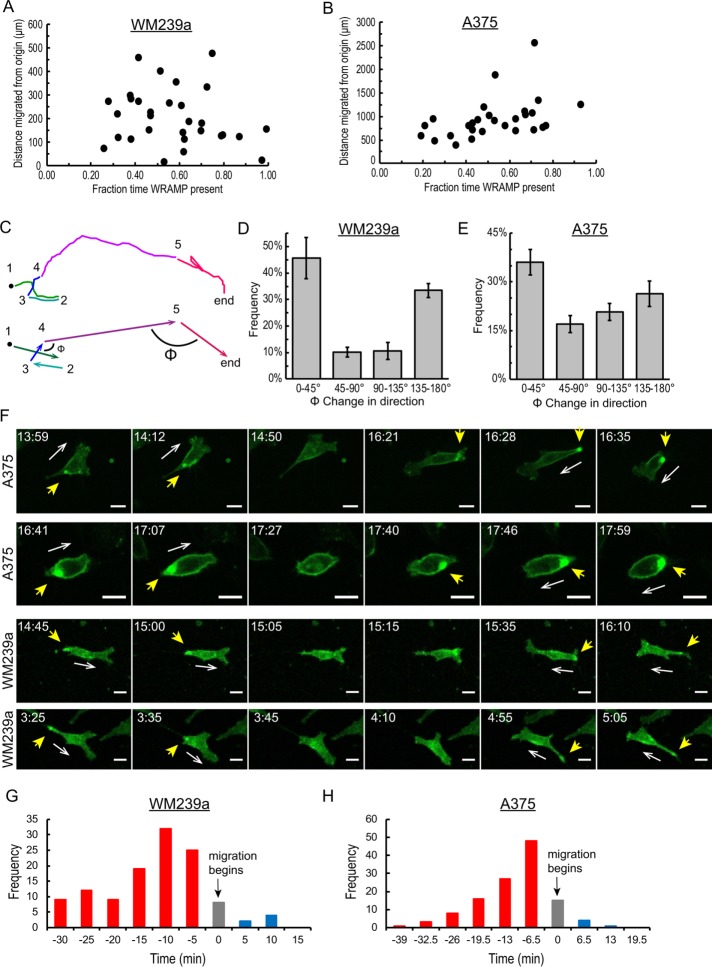
FIGURE 8:
Cells change direction during WRAMP– segments. (A, B) Plots of distance from origin over the entire cell trajectory vs. fraction of time with WRAMP+ segments show little correlation in 30 (A) WM239a and (B) A375 cells. (C) Example of cell trajectory, showing changes in direction between consecutive WRAMP+ segments (arrows), measured by angle Φ. (D, E) Histogram of the angle Φ, showing the changes in direction between >600 consecutive WRAMP+ segments for (D) 30 WM239a and (E) 30 A375 cells. Bars represent the mean and range for two biological replicates each tracking 30 cells (>600 values). (F) Confocal live-cell imaging of MCAM-GFP in A375 and WM239a cells (also see Supplemental Movie S11) shows changes in cell direction during periods when WRAMP structures are absent. The dynamic movement of the WRAMP structure allows intracellular repositioning within the cell before migration in a new direction. Yellow arrowheads indicate WRAMP structures scored by MCAM-GFP; white arrows indicate direction of cell movement. Scale bar, 20 μm; times in hours:minutes. All cells were treated with recombinant Wnt5a at the start of the experiment. (G, H) Histograms showing the times at which WRAMP structures reappear relative to the start of migration in a new direction in (G) WM239a (n = 120 cases across 30 cells; frames acquired every 5.0 min) and (H) A375 cells (n = 123 cases across 30 cells; frames acquired every 6.5 min). Red indicates cells where WRAMP structures reappeared before the start of migration. Gray indicates WRAMP structures reappearing in the same frame in which cells begin migrating. Blue indicates WRAMP structures reappearing after cells begin migrating.

