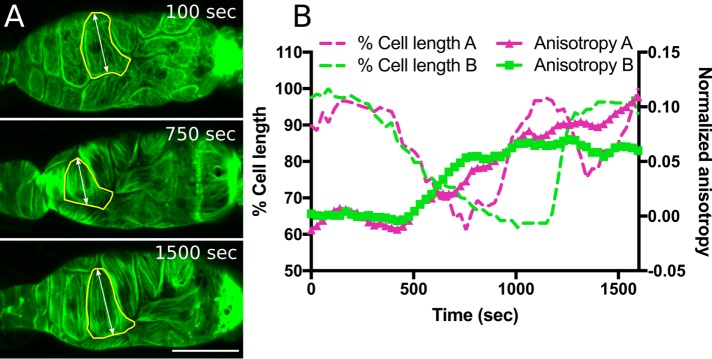
FIGURE 5:
Actin bundle alignment coincides with cell contraction during ovulation. (A) Maximum intensity projections from a 4D confocal ovulation movie of spermathecal cells expressing GFP-labeled actin (GFP::ACT-1). At 100 s after oocyte entry, spermathecal cells are stretched, yet display the webby preovulation actomyosin network. At 750 s after oocyte entry, contracting cells show development of parallel actomyosin bundles. At 1500 s after oocyte entry, spermathecal cells exhibit parallel actomyosin bundles oriented along the long axis of each cell. (B) Quantification of cell contraction and actomyosin bundle anisotropy (degree of alignment) in two cells from independent ovulation movies. FibrilTool was used to quantify actin anisotropy in individual cells (yellow outline in A). Cell shortening coincides with a rapid increase in actin anisotropy ∼500 s after oocyte entry. Scale bar, 20 μm.

