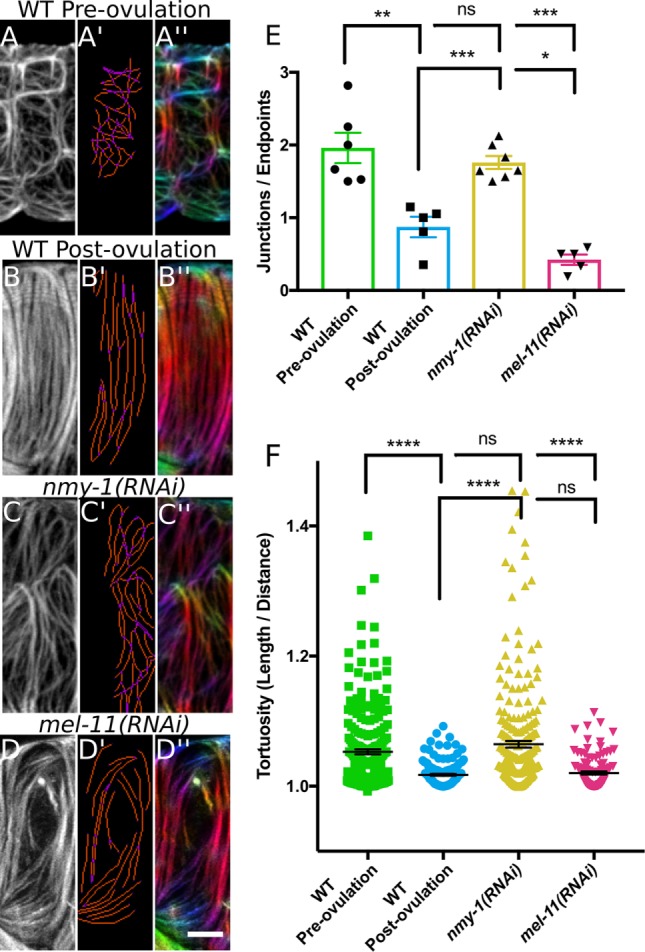
FIGURE 8:

Myosin activity influences actin bundle development and organization. (A–D) A single confocal z-slice of a spermathecal cell stained with phalloidin–Texas Red to label F-actin. (A’–D’) AnalyzeSkeleton analysis of bundles. Blue, endpoint (less than two neighbors); purple, junction (more than two neighbors); orange, slab (exactly two neighbors). Analysis indicates high actin bundle branching and/or intersection in a preovulation, WT cell (A’) and a nmy-1(RNAi) cell (C’); note increased purple pixels in A’ and C’ compared with B’ and D’. (A’’–D’’) OrientationJ was used to false-color actin bundles according to their orientation. Note that a postovulation, WT cell has parallel actin bundles oriented along the long cell axis. In a preovulation, WT cell (A’’) and a nmy-1(RNAi) cell (C’’), actin bundles are randomly oriented, as illustrated by many different colors. In a mell-11(RNAi) cell, some bundles are oriented correctly parallel to the long cell axis, but subpopulations are misaligned. (E) Quantification of actin bundle connectivity based on AnalyzeSkeleton results. The number of junctions (purple pixels) was divided by the number of endpoints (blue pixels). Each point represents analysis of a single cell with no more than two cells from the same animal and six, five, seven, and five cells for WT preovulation, WT postovulation, nmy-1(RNAi), and mel-11(RNAi), respectively. A value >1 indicates actin bundles more frequently intersected with or branched from neighboring bundles. A value <1 indicates actin bundles more frequently extended the length of the cell without contacting neighboring bundles. Note the increased actin bundle intersection and/or branching in preovulation, WT and nmy-1(RNAi) cells. (F) Quantification of actin bundle tortuosity (total length/linear distance between ends). Note increased actin bundle tortuosity in preovulation, WT cells and nmy-1(RNAi) cells. Each point represents an individual bundle measurement from five to seven different cells and 241, 145, 256, and 110 bundles for WT preovulation, WT postovulation, nmy-1(RNAi), and mel-11(RNAi), respectively. Error bars represent SEM. Unpaired t test (E) or Mann–Whitney test (F): ns, p > 0.05; *p ≤ 0.05; **p ≤ 0.01; ***p ≤ 0.001; ****p ≤ 0.0001. Scale bar, 5 μm.
