
Figure 2.
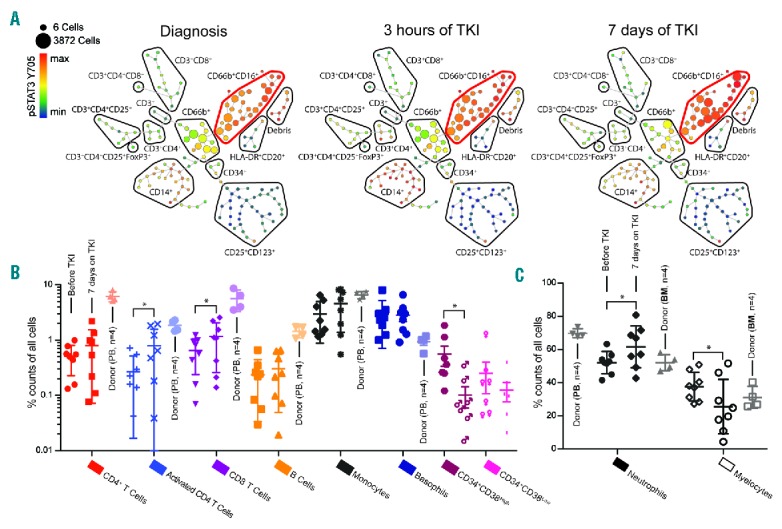
High-resolution single cell immune profiles of healthy and patient leukocytes. Longitudinally collected samples (before, after 3 hours and day 7 on nilotinib) from 8 patients in the ENEST1st trial, together with 4 healthy peripheral blood (PB) and bone marrow (BM) samples, were barcoded using the 20-plex metal barcoding kit (Fluidigm). (A) Data from the longitudinal samples from each patient, and the 4 healthy PB and BM samples, were pooled and clustered using the SPADE algorithm28 and manually annotated to identify cellular subsets. The SPADE tree analysis of patient 4702_0004 is shown. The size of each node represents the number of cells clustered and the expression of pSTAT3 Y705 is color-coded. The red bubble highlights the mature neutrophil population. (B and C) The relative abundance of the major PB populations identified in samples collected at diagnosis and after seven days of tyrosine kinase inhibitor (TKI) therapy is shown for the patient cohort (n=8, error bars showing standard error of mean, SEM), with the appropriate subpopulation in the healthy samples shown in a lighter shade. CD34+ cells could only be identified in 7 out of 8 patients. Wilcoxon matched-pairs rank test was used to identify statistically significant changes from before and after seven days of TKI therapy, where P≤0.05 was considered statistically significant.