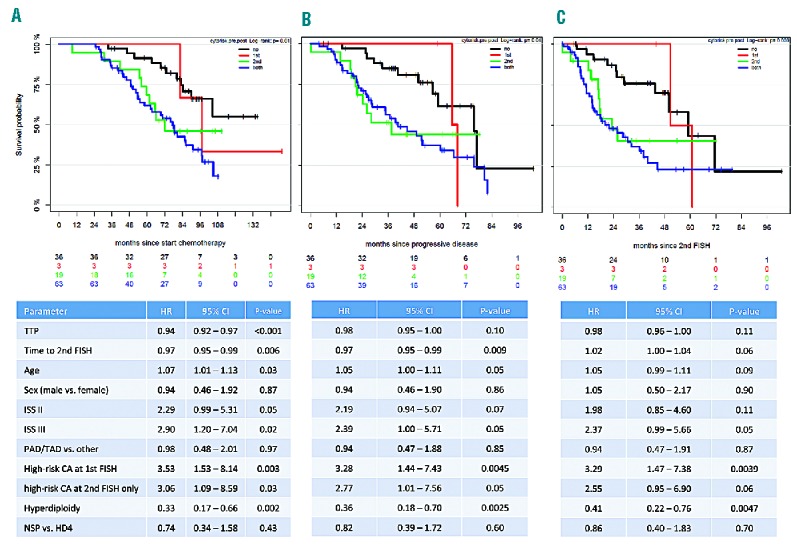
Figure 2.

Multivariate survival analysis from different landmarks. Kaplan-Meier plots and multivariate analyses for overall survival in patients without high-risk cytogenetic abnormalities (CA) at both time points (black line), high-risk CA only at first (red line), only at second (green line) or at both (blue line) FISH analyses. Different landmarks were used: (A) from start of chemotherapy, (B) from progressive disease, (C) from second FISH analysis.
