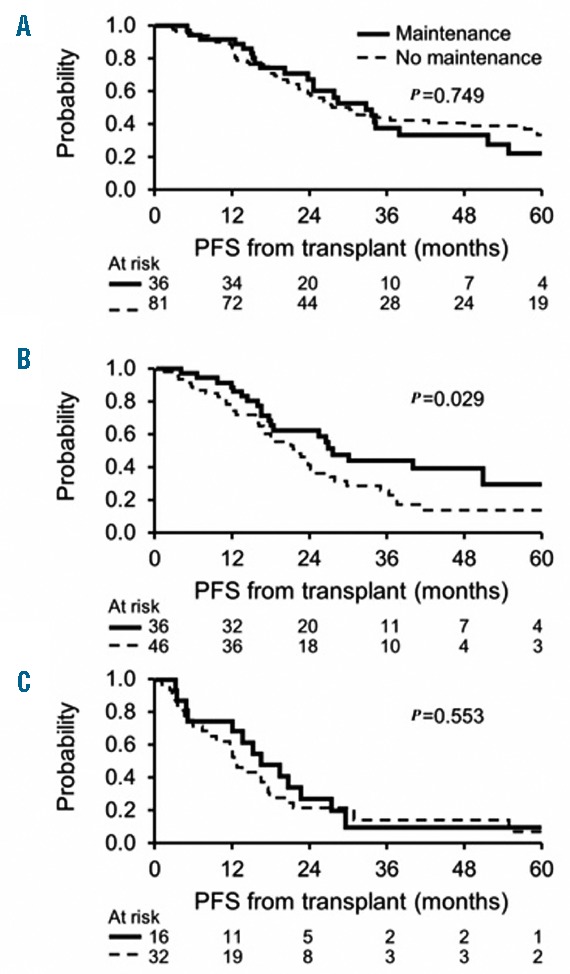
Figure 2.

Kaplan-Meier curves depicting progression-free survival (PFS) in different groups stratified by the receipt of post-transplant maintenance therapy. (A) CPC−/−; (B) CPC+/−; (C) CPC+/+ or −/+.

Kaplan-Meier curves depicting progression-free survival (PFS) in different groups stratified by the receipt of post-transplant maintenance therapy. (A) CPC−/−; (B) CPC+/−; (C) CPC+/+ or −/+.