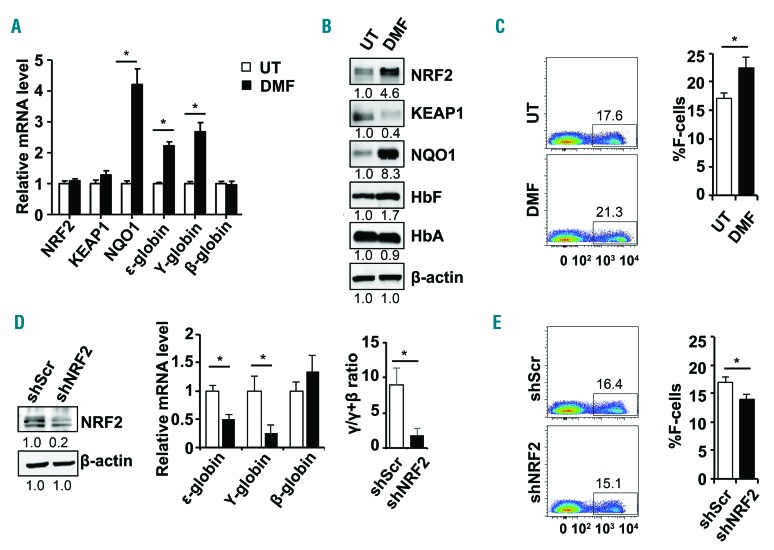
Figure 1.
DMF and shNRF2 modulates γ-globin gene expression in human normal erythroid progenitors. (A) Erythroid progenitors generated in liquid culture system from CD34+ stem cells were treated at day 8 with 200 μM dimethyl fumarate (DMF) for 48 hours. Reverse transcription-quantitative PCR (RT-qPCR) was conducted for untreated erythroid progenitors (white bars) or cells treated with DMF (black bars) to determine the mRNA levels for the genes shown. The expression of gene in untreated erythroid progenitors was set to one after being normalized to the internal control glyceraldehyde phosphate dehydrogenase (GAPDH) mRNA levels. The quantitative data are shown as the mean ± standard error of the mean (SEM) of 3–5 independent experiments; *P<0.05. (B) Western blot analysis was conducted for the protein shown with total protein isolated from UT- and DMF-treated erythroid progenitors. The relative protein expression was quantified by densitometry with β-actin as the loading control. (C) Flow cytometry analysis was conducted to determine the %HbF positive cells (%F-cells) for UT-and DMF-treated erythroid progenitors stained with fluorescein isothiocyanate (FITC) labeled anti-HbF antibody. Representative dot plots for F-cell distribution are shown on the left and quantitative data in the graph on the right. (D) To test the effects of gene silencing, erythroid progenitors were treated on day 4 with scramble (shScr) or shNRF2 lentiviral particles; after 48 hours cells were selected with puromycin (0.8 μg/mL) until analysis on day 10. Western blot analysis for NRF2 was conducted; the lower band represents non-specific antibody binding. Shown in the middle is RT-qPCR data for the shNRF2 stable lines; the relative mRNA levels expressed as the γ/γ+β ratio is shown in the graph on the right. (E) Flow cytometry analysis was conducted to determine the %F-cells in erythroid progenitors after stable shNRF2 expression using methods described in (C). Representative dot plots for F-cell distribution are shown on the left and quantitative data in the graph on the right.

