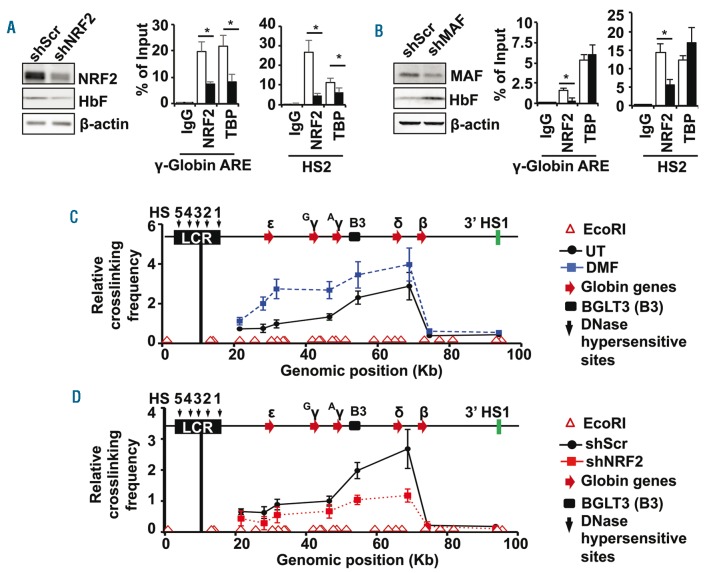
Figure 3.
NRF2 facilitates chromatin looping in the HBB locus of primary erythroid progenitors. (A) KU812 stable cell lines were produced with shScr and shNRF2 lentiviral particles to determine the effects on HbF and NRF2 protein levels by western blot analysis (left graph); β-actin was used as loading control. ChIP assay (right graph) was completed to quantify NRF2 and TBP binding to the regions shown with IgG as an antibody control. (B) A third KU812 cell line was produced with shMAF lentiviral particles; western blot analysis (left) and ChIP assay (right) were conducted as described in (A). (C) Chromatin looping in the HBB locus was analyzed by the chromosome conformation capture (3C) assay for UT and DMF treatment primary erythroid cells (Online Supplementary Methods). The positions of the EcoRI restriction sites are shown by the open red triangles above the x-axis and the relative position of the five HBB locus globin genes by the red arrows. The position of the β-globin locus transcript 3 (BGLT3, B3), long non-coding RNA is indicated by the black box; HS5-1, DNase I hypersensitive sites. The relative distance of individual globin genes to the anchor encompassing HS4, HS3 and HS2 (black line) is indicated in kb. The relative crosslinking frequency between the anchor and other EcoRI fragments was determined by qPCR analysis. The data are shown as the mean ± standard error of the mean of 3 independent experiments. (D) The 3C assay was conducted for the shScr (●) and shNRF2 (■) lentiviral particle transduced erythroid progenitors. The relative crosslinking frequency of the anchor with the downstream sites is shown.

