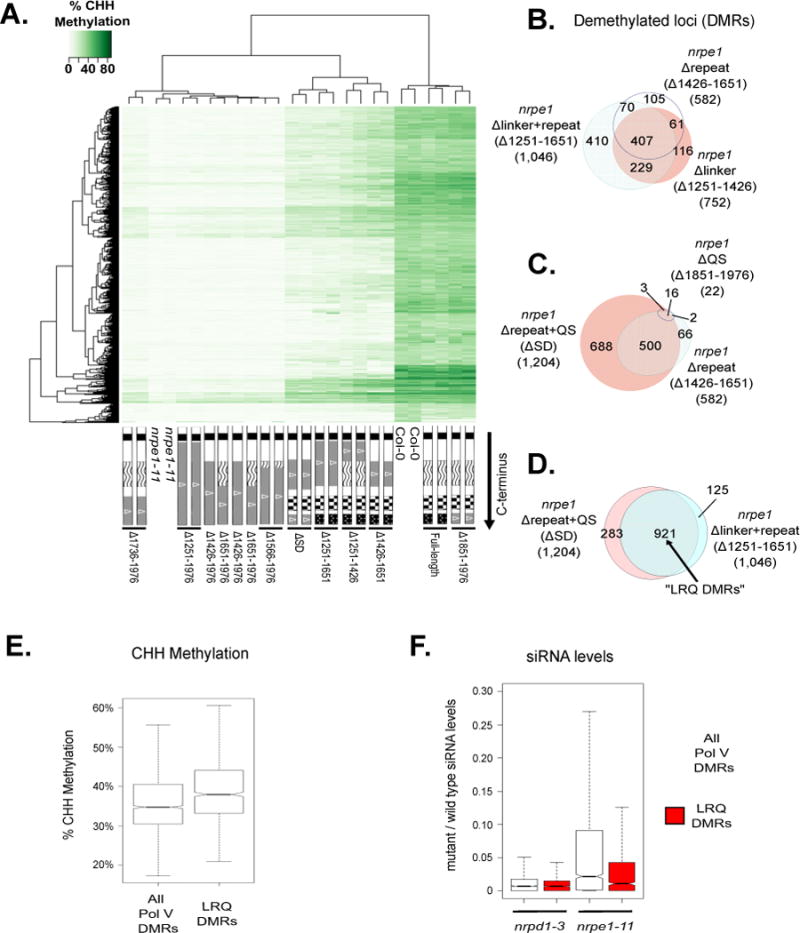
Figure 3.

Functional relationships among Pol V CTD subdomains.
A. Heatmap clustering of % CHH methylation levels within Pol V DMRs for CTD deletion
mutants, wild-type (Col-0) and nrpe1-11 controls.
B–D. Venn diagrams showing subsets of the 2,259 total Pol V CHH DMRs that remain significantly hypo-methylated when the indicated CTD mutants are expressed in the nrpe1 mutant background. nrpe1 Δ1251–1651 and nrpe1 ΔSD in (D) collectively represent deletions in the linker, repeat, and QS subdomains, thus the subset of DMRs un-rescued by both constructs are referred to as LRQ DMRs.
E. Box plot of % CHH methylation in wild type plants within all Pol V CHH DMRs, compared to the 921 LRQ DMRs defined in panel D.
F. Box plot showing the ratio of siRNA levels (in reads per million; RPM) in nrpd1-3 and nrpe1- 11 mutants relative to wild-type Col-0. Total Pol V DMRs (white) are compared to the 921 LRQ DMRs defined in panel D (red). See also Table S2 and S3.
