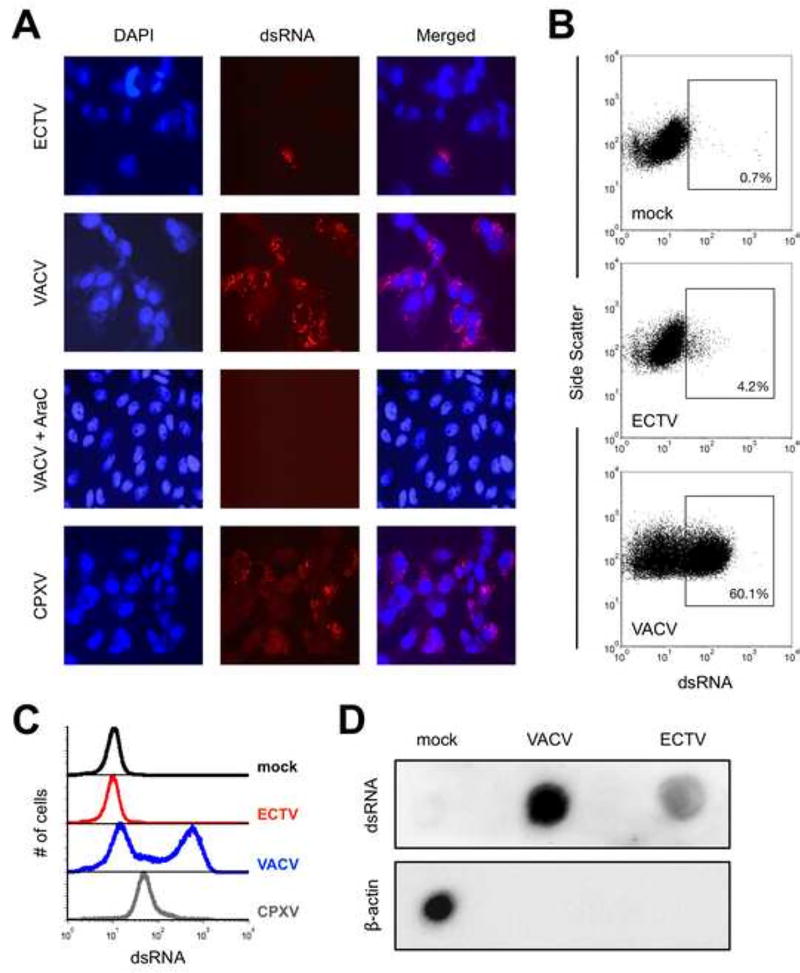
Figure 1. The accumulation of dsRNA greatly varies after infection with different orthopoxviruses.
(A) BS-C-1 cells were infected (MOI=10) with ECTV, VACV, or CPXV for 24 hrs. prior to staining for dsRNA (red) and cell nuclei/virus factories (DAPI; blue). Images were merged using ImageJ software, are at 400× total magnification, and representative of three independent trials. AraC was added at the time of infection where indicated. (B) BS-C-1 cells were infected (MOI=10) with either ECTV or VACV for 24 hrs. prior to staining intracellularly for dsRNA and analyzed using flow cytometry. Positive gates were drawn based upon the mock condition. The depicted data are representative of four independent trials. (C) Flow cytometry was used to measure dsRNA levels within infected cells as above. The data are shown in histogram format and representative of four independent trials. (D) BS-C-1 cells were infected (MOI=10) with ECTV or VACV. RNA was isolated at 24 hrs. post-infection using the RNeasy Plus Mini Kit (Qiagen) and 5 µg RNA was spotted onto a membrane. dsRNA was detected using the J2 antibody and beta-actin mRNA was detected using a biotin-labeled antisense RNA as described in the methods.

