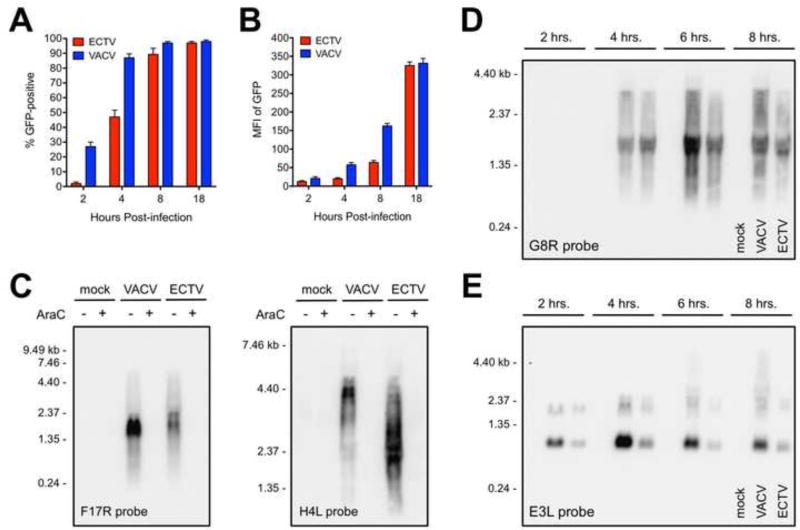
Figure 4. ECTV exhibits reduced mRNA abundance and less read-through of some genes relative to VACV.
BS-C-1 cells were infected (MOI=10) with recombinant versions of ECTV and VACV containing the GFP gene under the control of the same promoter. At the indicated times post-infection, cells were isolated and analyzed for (A) GFP positivity and (B) median fluorescence intensity (MFI) using flow cytometry. The bars depict the average values and the error bars represent the standard deviations of three independent experiments. (C) Total RNA was isolated from infected (MOI=5) BS-C-1 cells at 18 hrs. post-infection. RNA probes specific for F17R (left panel) and H4L (right panel) were used in a Northern blot assay. AraC was included in some conditions at the time of infection. (D and E) Northern blot analysis of G8R and E3L transcripts was carried out in a time course format using a similar procedure as above. (C–E) Each lane contained 5 µg of total RNA. Data are representative of two independent trials. Sizes (in kilobases, kb) of the RNA standards are indicated.

