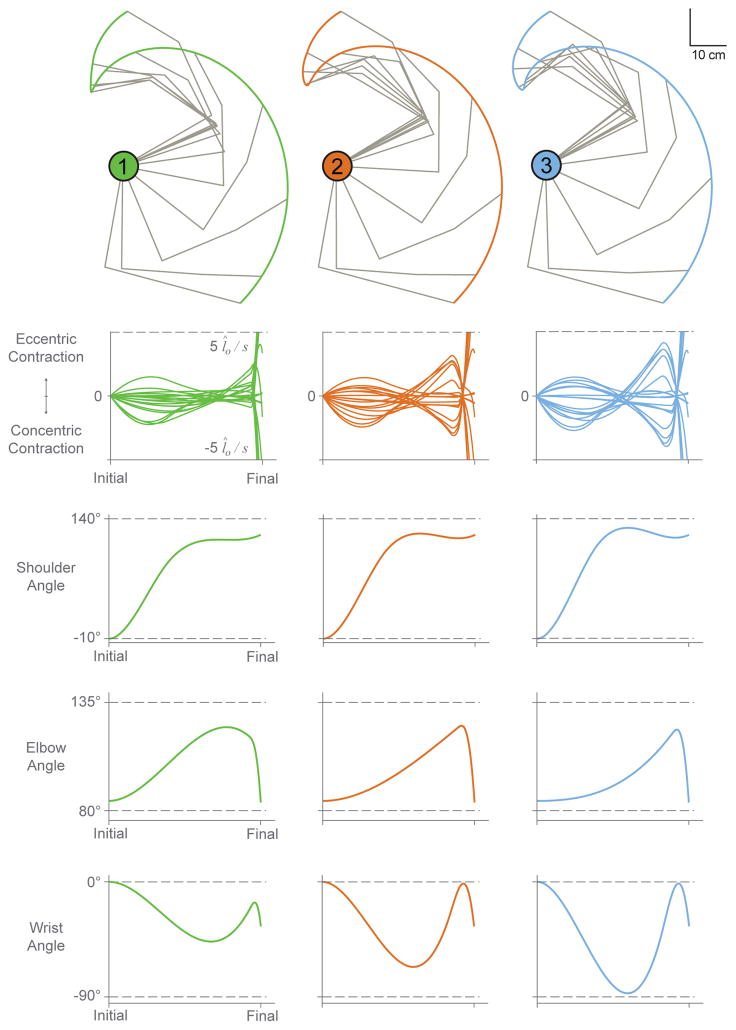
Figure 9.
Sample trajectories 1, 2, and 3 shown in endpoint space (top) with their corresponding normalized muscle velocity profiles and joint angle trajectories (bottom 3 rows). Note that the dotted lines in the velocity plots indicate ±5 l̂o/s, while dotted lines in the joint angle plots indicate the allowable range of motion for each joint.

