Figure 3.
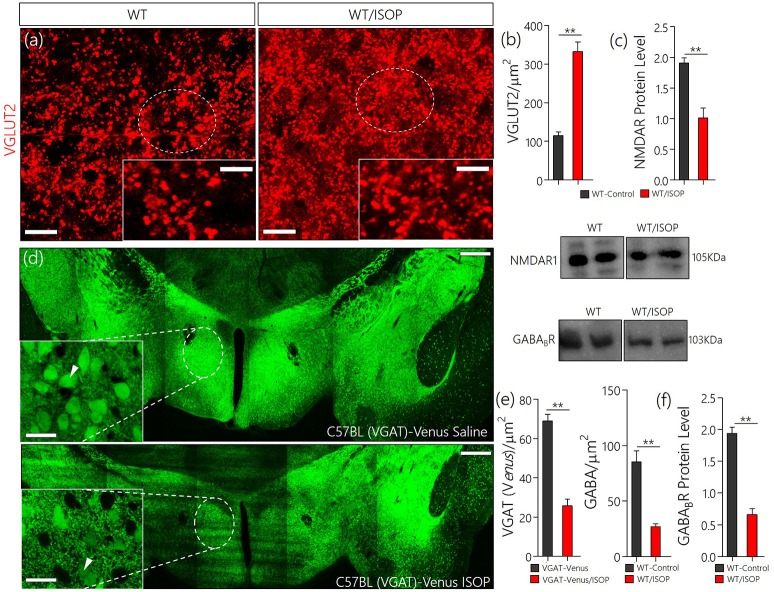
(a) Vesicular glutamate transporter expression (VGLUT 2) in the PVN of ISOP treated WT mice vs. the control (**p < 0.01; scale bar = 10 μm). (b) Bar chart showing an increase in VGLUT2 within the PVN of ISOP treated WT mice. (c) Immunoblots showing downregulation of NMDAR in the PVN of WT/ISOP treated mice; vs. the control (**p < 0.01). (d) Representative confocal image of the PVN for control and ISOP treated transgenic C57BL (VGAT)-Venus mice; expressing Venus in the inhibitory neurons. Subsequent quantification indicates a decrease in the yield of inhibitory neurons in the PVN of ISOP- vs. saline-treated mice (**p < 0.01; scale bar = 200 and 10 μm). Arrow heads indicate Venus positive neurons in the PVN. (e) Statistical representation of Venus positive cell count in the PVN of control and ISOP treated (VGAT)-Venus mice. (f) Quantitative protein analysis for PVN GABABR expression. Like VGAT, there was a significant decrease in GABABR expression in the PVN vs. the control (**p < 0.01).

