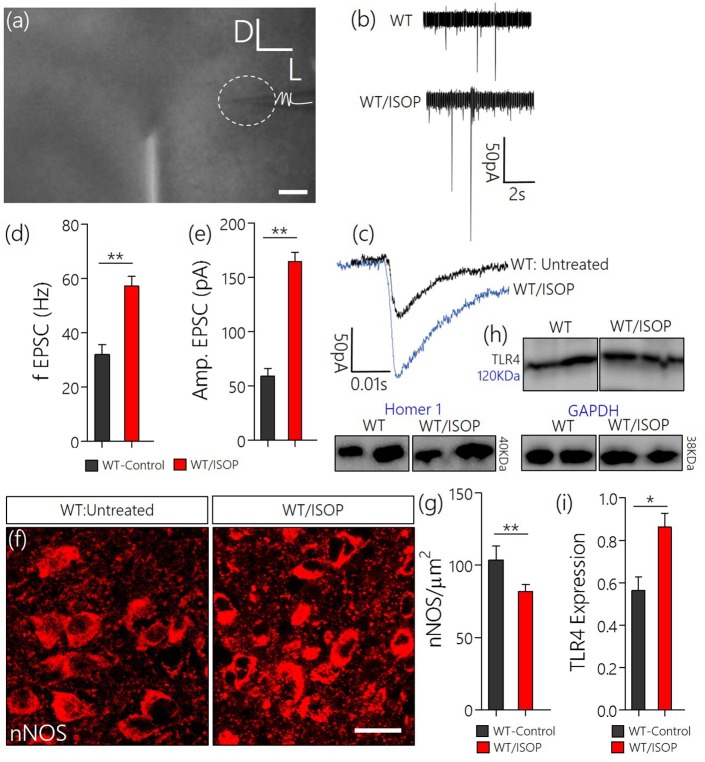
Figure 4.
(a) Phase contrast image showing the relative placement of patch pipette electrode in acute slice (PVN) physiology (Scale bar = 100 μm). (b,c) Spontaneous EPSCs recorded from the PVN of control mice, and mice previously treated with ISOP (in vivo). ISOP treated WT mice showed an increase in the frequency (**p < 0.01) and amplitude (**p < 0.01) of spontaneous EPSCs when compared with control (untreated WT) PVN neurons. (d,e) Bar chart depicting a significant increase in the frequency (**p < 0.01) and amplitude (**p < 0.01) of EPSCs in the PVN of ISOP treated mice. (f,g) Representative confocal images showing a decrease in nNOS in the PVN after a systemic ISOP treatment (Scale bar = 20 μm). This further supports a change in NMDAR function and synaptic stress after an acute systemic adrenergic activation. (h) In addition to a decrease in nNOS, TLR expression increased in the PVN of WT/ISOP mice (*p < 0.05). (i) Bar chart showing the normalized TLR4 expression for control (WT) and WT/ISOP groups.

