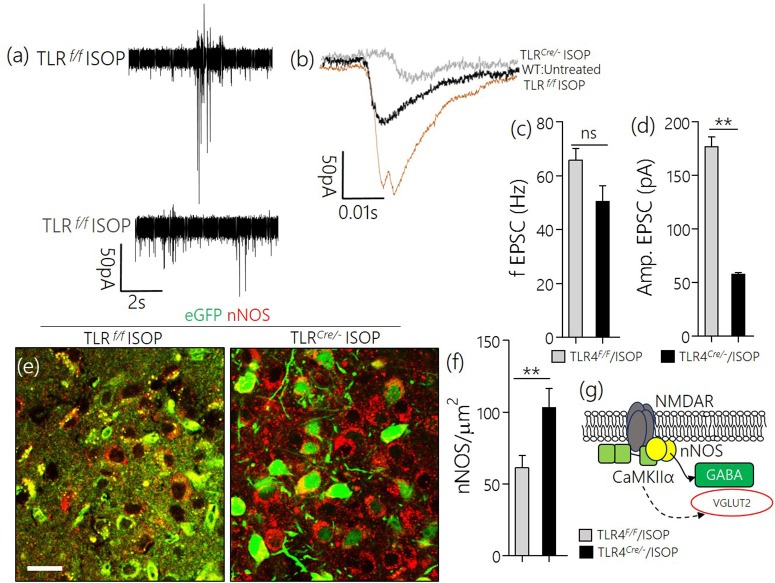
Figure 8.
(a,b) Spontaneous EPSC recording from the PVN of ISOP treatment (in vivo) mice. While the frequency of EPSCs increased for both TLR4Cre/− and TLR4loxp/loxp PVN neurons (ns), the amplitude decreased significantly in the TLR4 knockout group (**p < 0.01). (c,d) Bar chart illustrating a change in frequency and amplitude of EPSCs for ISOP treated TLR4Cre/− and TLR4loxp/loxp mice. (e) Confocal images showing the colocalization of eGFP and nNOS in the PVN. The distribution of the neuronal stress marker reduced significantly in the TLR4loxp/loxp mice when compared with the TLR4Cre/− groups after ISOP treatment (scale bar = 20 μm). (f) Bar chart showing the relative change in PVN nNOS expression for the TLR4loxp/loxp and TLR4Cre/− mice after systemic ISOP treatment. (g) Schematic illustration of the mechanism through which synaptic expression of nNOS can depict a change in the activity of GABA or Glutamate in the PVN.

