
Figure 2.
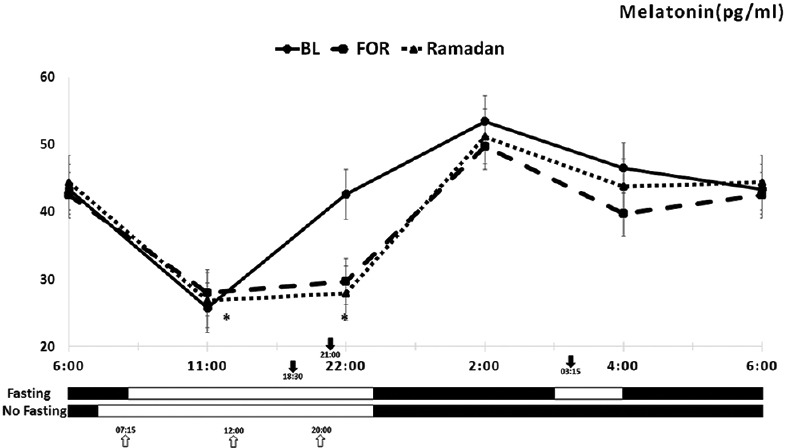
Circadian pattern of plasma melatonin concentrations in eight healthy male volunteers before and during Ramadan daytime fasting. Each point represents the mean and standard deviation of eight participants. Values at baseline ( ), baseline fasting before Ramadan (
 ), and Ramadan (-▴-) are presented. The dark-headed arrows indicate the meal time during fasting (Ramadan and baseline fasting), and the white-headed arrows indicate the meal time during baseline. (
 ) indicates awake, and (
 ) indicates sleep