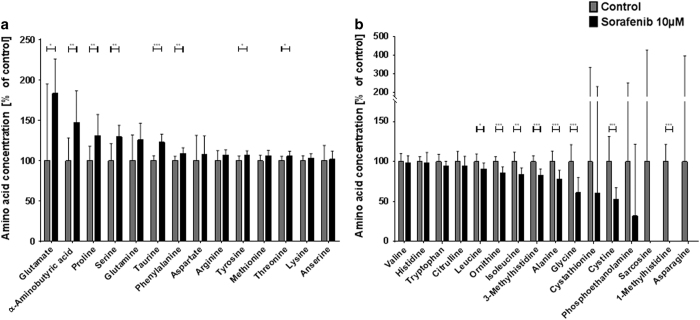
Figure 2.
Sorafenib disturbs the extracellular amino acid profile of neurons. Primary hippocampus cultures were incubated with 10 μM sorafenib (or control) for 24 h and their supernatant was collected and analyzed by high-performance liquid chromatography (HPLC). (a) Amino acids upregulated in response to 10 μM sorafenib treatment with their concentration relative to the respective controls. Asterisks indicate the level of significance in an unpaired two-sided t-test. The bar plot shows means with standard deviations. Numbers of experiments: n=12 for control, n=8 for 10 μM sorafenib. (b) Amino acids downregulated in response to 10 μM sorafenib treatment with their concentration relative to the respective controls. Asterisks indicate the level of significance in an unpaired two-sided t-test. The bar plot shows means with standard deviations. Numbers of experiments: n=12 for control, n=8 for 10 μM sorafenib. Levels of significance: *P<0.05, **P<0.01, ***P<0.001. A comprehensive table of all descriptive statistics and the analysis parameters can be found in Table 1.

